

Key points:
Key points:
Bitcoin witnessed the biggest long liquidation of the year, indicating that bulls are losing their grip over the market.
Bitcoin witnessed the biggest long liquidation of the year, indicating that bulls are losing their grip over the market.
Several altcoins are striving to hold on to their support levels but may face solid selling on rallies.
Several altcoins are striving to hold on to their support levels but may face solid selling on rallies.
Bitcoin (BTC) fell to $111,800 on Monday but has since then recovered above the $112,700 level. The nasty fall was due to liquidation of leverage positions. CoinGlass said in a post on X that traders faced $1.62 billion in long liquidations in 24 hours, which was the biggest long liquidation of this year.
Bitcoin (BTC) fell to $111,800 on Monday but has since then recovered above the $112,700 level. The nasty fall was due to liquidation of leverage positions. CoinGlass said in a post on X that traders faced $1.62 billion in long liquidations in 24 hours, which was the biggest long liquidation of this year.
Select analysts are not perturbed by the fall as they anticipate BTC to turn around and charge higher in October. Since 2013, BTC has risen 10 out of 12 times in October; the last loss was way back in 2018, according to CoinGlass. BTC could hit a new all-time high in October if history repeats itself.
Select analysts are not perturbed by the fall as they anticipate BTC to turn around and charge higher in October. Since 2013, BTC has risen 10 out of 12 times in October; the last loss was way back in 2018, according to CoinGlass. BTC could hit a new all-time high in October if history repeats itself.
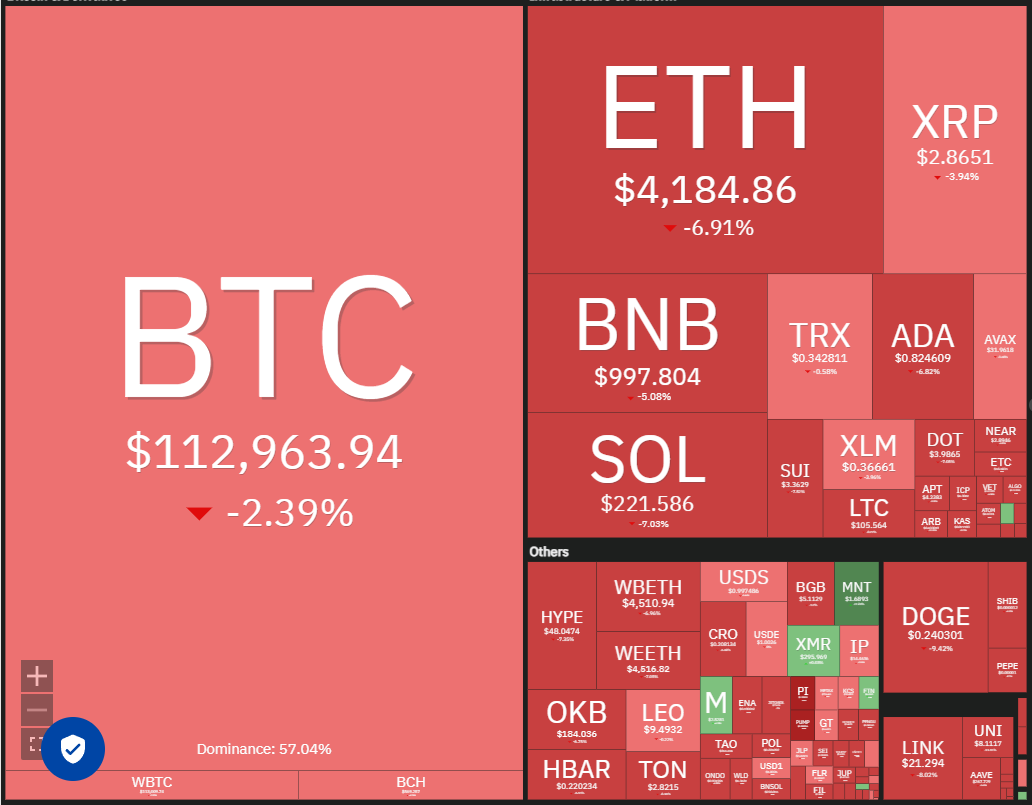
Another positive for the markets is the policy shift by the US Federal Reserve. Economist Timothy Peterson told Cointelegraph that the markets are underpricing the possibility of rapid rate cuts, and when the surprise effect kicks in, it could “jolt Bitcoin and alts up substantially,” in the next 3-9 months.
Another positive for the markets is the policy shift by the US Federal Reserve. Economist Timothy Peterson told Cointelegraph that the markets are underpricing the possibility of rapid rate cuts, and when the surprise effect kicks in, it could “jolt Bitcoin and alts up substantially,” in the next 3-9 months.
Could BTC and altcoins hold on to their respective support levels? Let’s analyze the charts of the top 10 cryptocurrencies to find out.
Could BTC and altcoins hold on to their respective support levels? Let’s analyze the charts of the top 10 cryptocurrencies to find out.
S&P 500 Index price prediction
S&P 500 Index price prediction
The S&P 500 Index (SPX) hit another new all-time high on Monday, signaling sustained buying by the bulls.
The S&P 500 Index (SPX) hit another new all-time high on Monday, signaling sustained buying by the bulls.
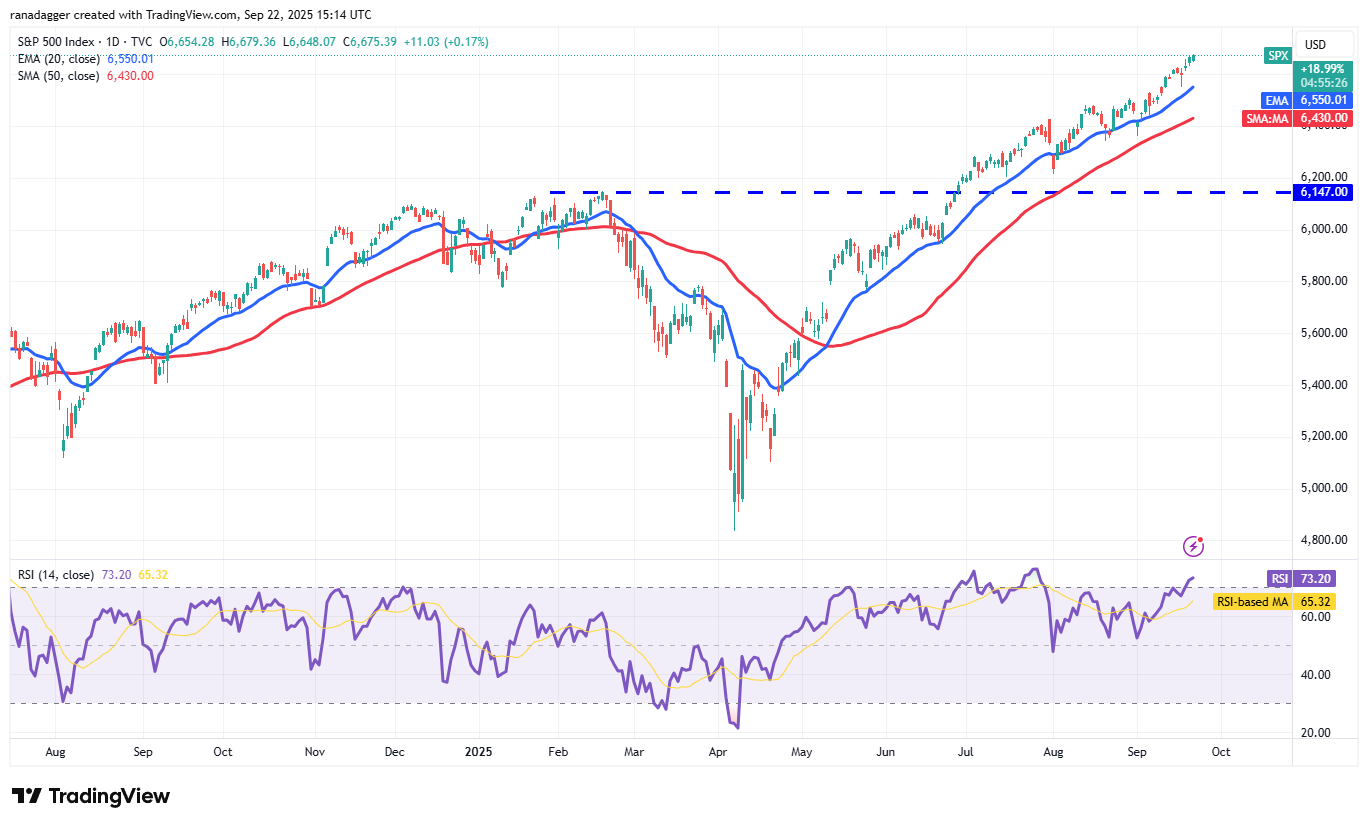
The rally could reach 6,700, where the bears may mount a strong defense. Any dip is likely to find support at the 20-day exponential moving average (6,550). If the price rebounds off the 20-day EMA and breaks above 6,700, the next stop could be the 7,000 level.
The rally could reach 6,700, where the bears may mount a strong defense. Any dip is likely to find support at the 20-day exponential moving average (6,550). If the price rebounds off the 20-day EMA and breaks above 6,700, the next stop could be the 7,000 level.
Sellers will have to tug the price below the 50-day simple moving average (6,430) to weaken the bullish momentum. If they do that, the index could start a deeper correction to 6,343 and then to 6,200.
Sellers will have to tug the price below the 50-day simple moving average (6,430) to weaken the bullish momentum. If they do that, the index could start a deeper correction to 6,343 and then to 6,200.
US Dollar Index price prediction
US Dollar Index price prediction
The US Dollar Index (DXY) rebounded off the 96.37 support on Wednesday, indicating that the bulls are fiercely defending the level.
The US Dollar Index (DXY) rebounded off the 96.37 support on Wednesday, indicating that the bulls are fiercely defending the level.
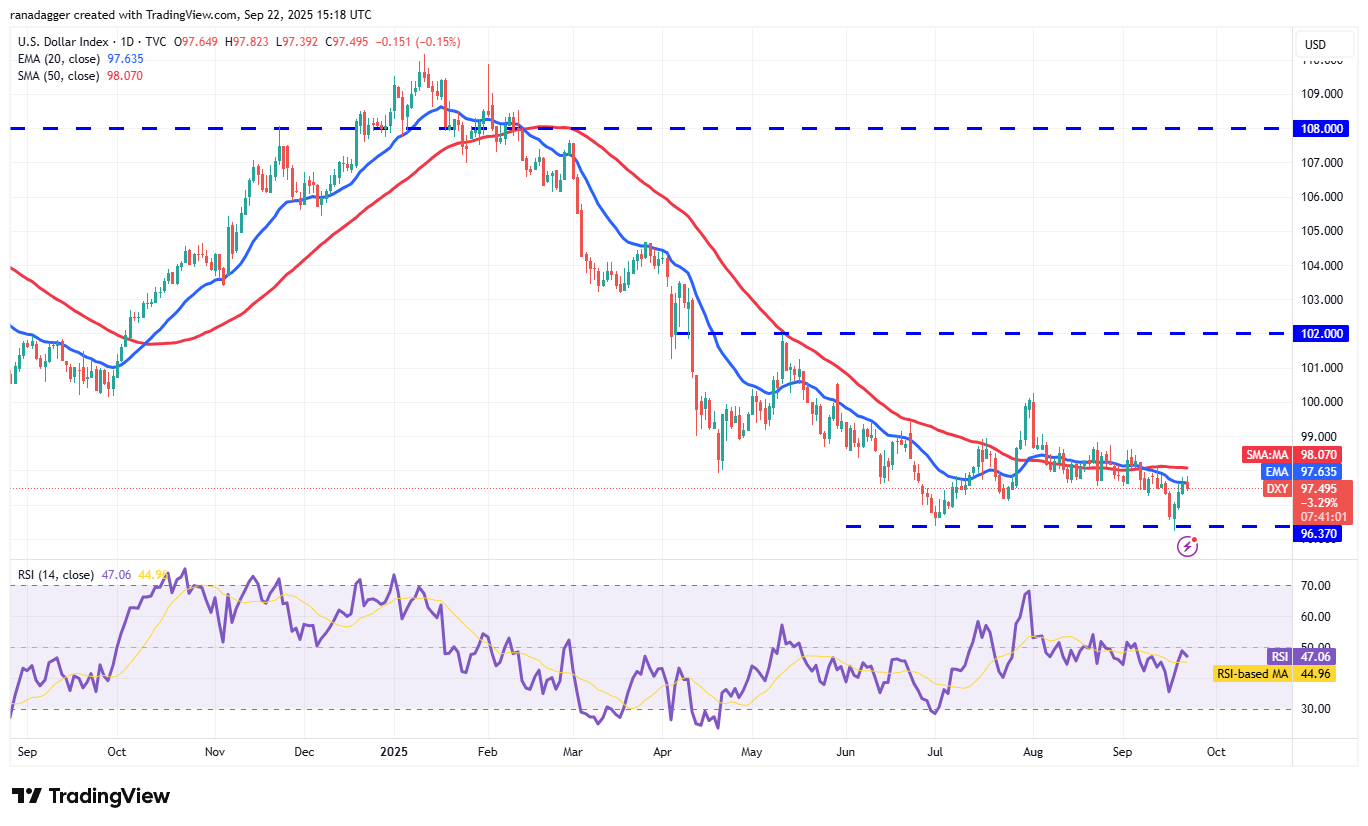
The recovery is expected to face selling at the moving averages. If the price turns down sharply from the moving averages, the bears will make one more attempt to sink the index below the 96.37 support. If they can pull it off, the index could extend the downtrend to the 95 level.
The recovery is expected to face selling at the moving averages. If the price turns down sharply from the moving averages, the bears will make one more attempt to sink the index below the 96.37 support. If they can pull it off, the index could extend the downtrend to the 95 level.
Conversely, a break and close above the moving averages suggests that the buyers are trying to form a double bottom at 96.37. The index may recover to 99 and then to 100.50.
Conversely, a break and close above the moving averages suggests that the buyers are trying to form a double bottom at 96.37. The index may recover to 99 and then to 100.50.
Bitcoin price prediction
Bitcoin price prediction
BTC’s failure to rise above the $117,500 resistance may have attracted selling by short-term investors, which accelerated after the price broke below the moving averages.
BTC’s failure to rise above the $117,500 resistance may have attracted selling by short-term investors, which accelerated after the price broke below the moving averages.
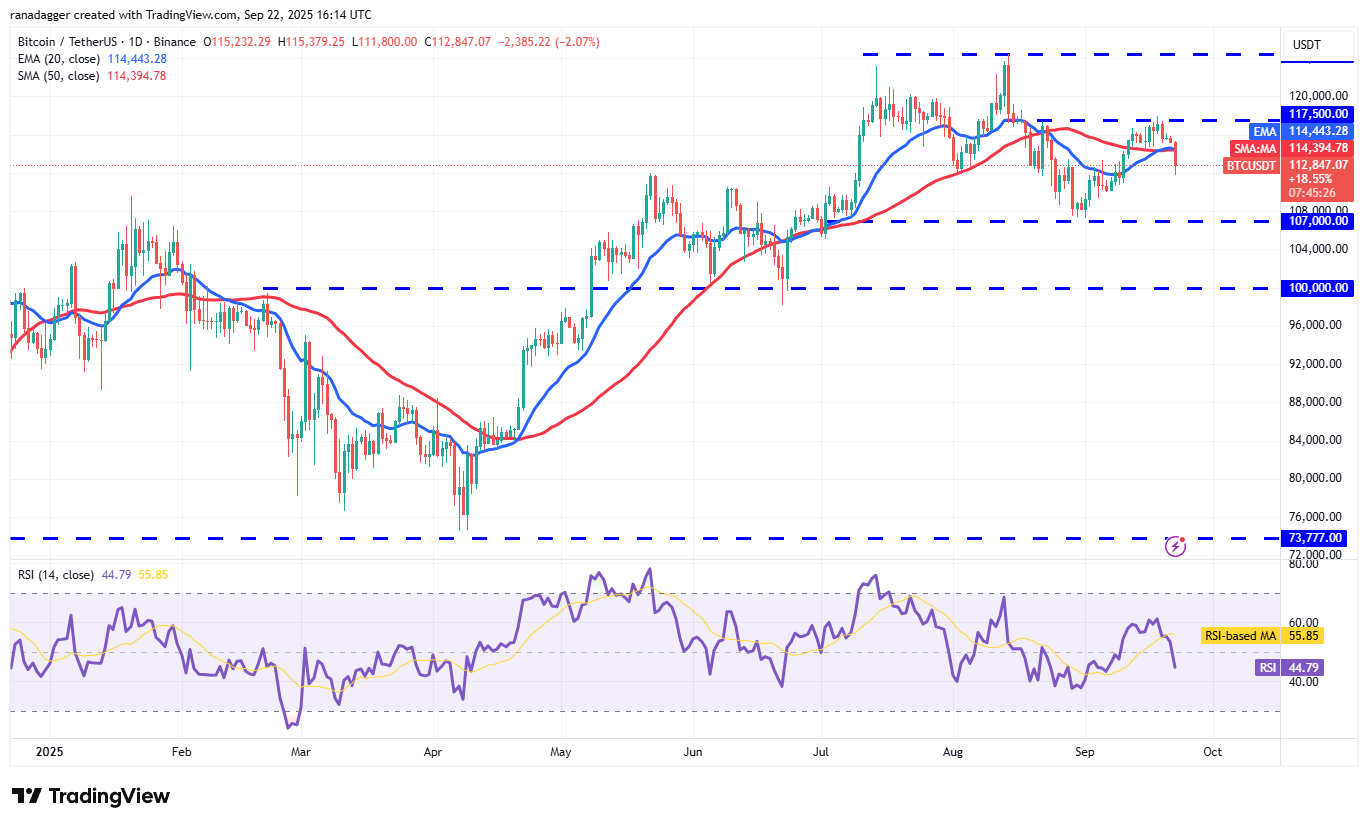
The flattish moving averages and the relative strength index (RSI) just below the midpoint suggest a range-bound action in the near term. Buyers are expected to defend the support of the range at $107,000 because a break below it may sink the BTC/USDT pair to $100,000.
The flattish moving averages and the relative strength index (RSI) just below the midpoint suggest a range-bound action in the near term. Buyers are expected to defend the support of the range at $107,000 because a break below it may sink the BTC/USDT pair to $100,000.
A break and close above $117,500 on the upside signals that the bulls are attempting a comeback. The Bitcoin price may then ascend to the $124,474 resistance. Buyers will have to pierce the $124,474 level to open the gates for a rally to $141,948.
A break and close above $117,500 on the upside signals that the bulls are attempting a comeback. The Bitcoin price may then ascend to the $124,474 resistance. Buyers will have to pierce the $124,474 level to open the gates for a rally to $141,948.
Ether price prediction
Ether price prediction
Ether (ETH) plummeted below the support line of the symmetrical triangle pattern on Monday, indicating that the bears have overpowered the bulls.
Ether (ETH) plummeted below the support line of the symmetrical triangle pattern on Monday, indicating that the bears have overpowered the bulls.
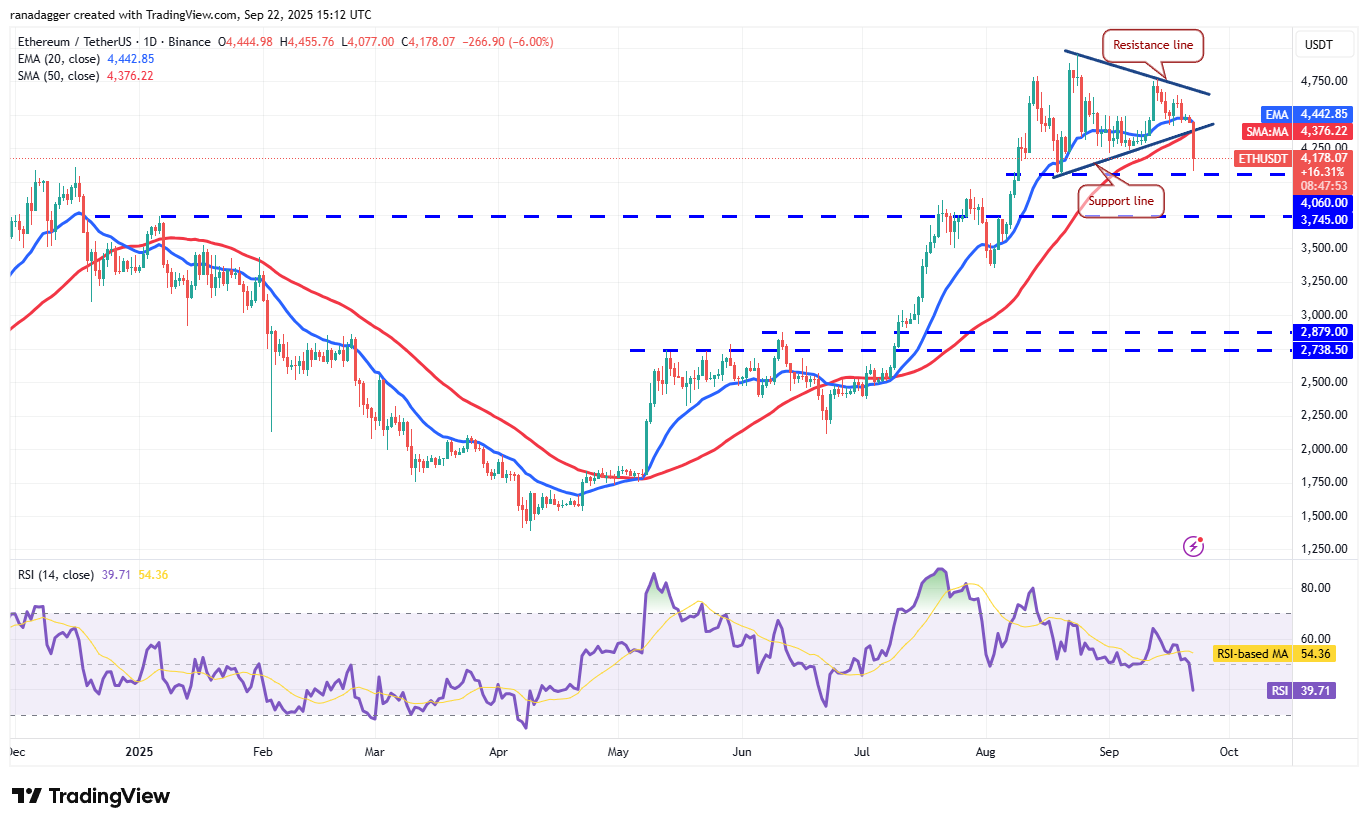
The ETH/USDT pair has reached the $4,060 level, which is likely to attract solid buying from the bulls. Any recovery attempt is expected to face selling at the 20-day EMA ($4,442). If the Ether price turns down from the 20-day EMA, the risk of a break below $4,060 increases. The pair could then decline to $3,745 and later to the pattern target of $3,426.
The ETH/USDT pair has reached the $4,060 level, which is likely to attract solid buying from the bulls. Any recovery attempt is expected to face selling at the 20-day EMA ($4,442). If the Ether price turns down from the 20-day EMA, the risk of a break below $4,060 increases. The pair could then decline to $3,745 and later to the pattern target of $3,426.
This negative view will be invalidated in the near term if the price turns up and breaks above the resistance line. That suggests a range-bound action between $4,060 and $4,957 for a few days.
This negative view will be invalidated in the near term if the price turns up and breaks above the resistance line. That suggests a range-bound action between $4,060 and $4,957 for a few days.
XRP price prediction
XRP price prediction
XRP (XRP) plunged to the $2.69 support on Monday, signaling that the bears are trying to seize control.
XRP (XRP) plunged to the $2.69 support on Monday, signaling that the bears are trying to seize control.
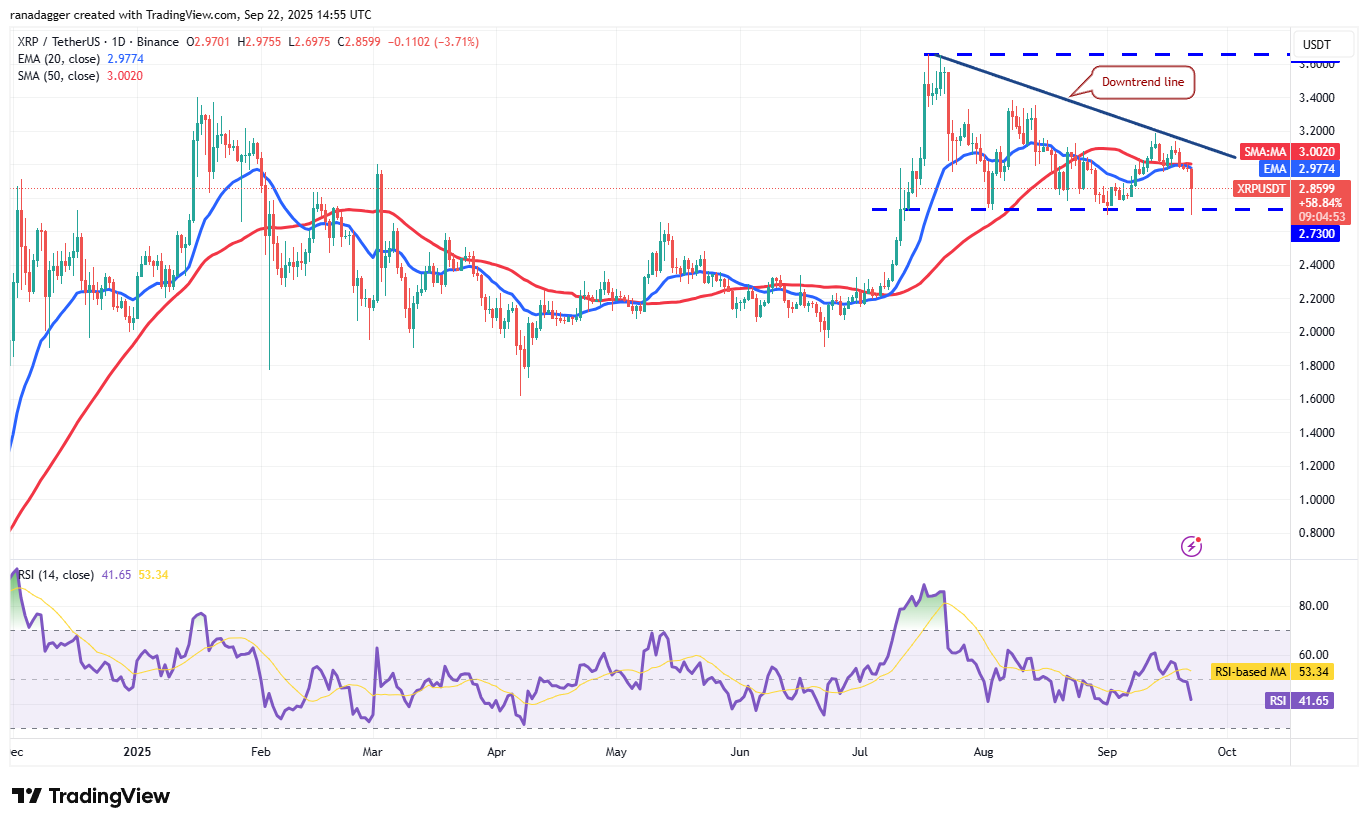
The long tail on the candlestick shows aggressive buying at $2.69. If buyers want to make a comeback, they will have to swiftly propel the XRP price above the downtrend line. If they do that, the XRP/USDT pair may ascend to $3.40.
The long tail on the candlestick shows aggressive buying at $2.69. If buyers want to make a comeback, they will have to swiftly propel the XRP price above the downtrend line. If they do that, the XRP/USDT pair may ascend to $3.40.
On the contrary, the pair will complete a bearish descending triangle pattern if the price closes below $2.69. That tilts the advantage in favor of the bears and increases the risk of a drop to $2.20.
On the contrary, the pair will complete a bearish descending triangle pattern if the price closes below $2.69. That tilts the advantage in favor of the bears and increases the risk of a drop to $2.20.
BNB price prediction
BNB price prediction
BNB (BNB) turned down from the all-time high of $1,083 on Sunday, indicating profit booking by the short-term buyers.
BNB (BNB) turned down from the all-time high of $1,083 on Sunday, indicating profit booking by the short-term buyers.
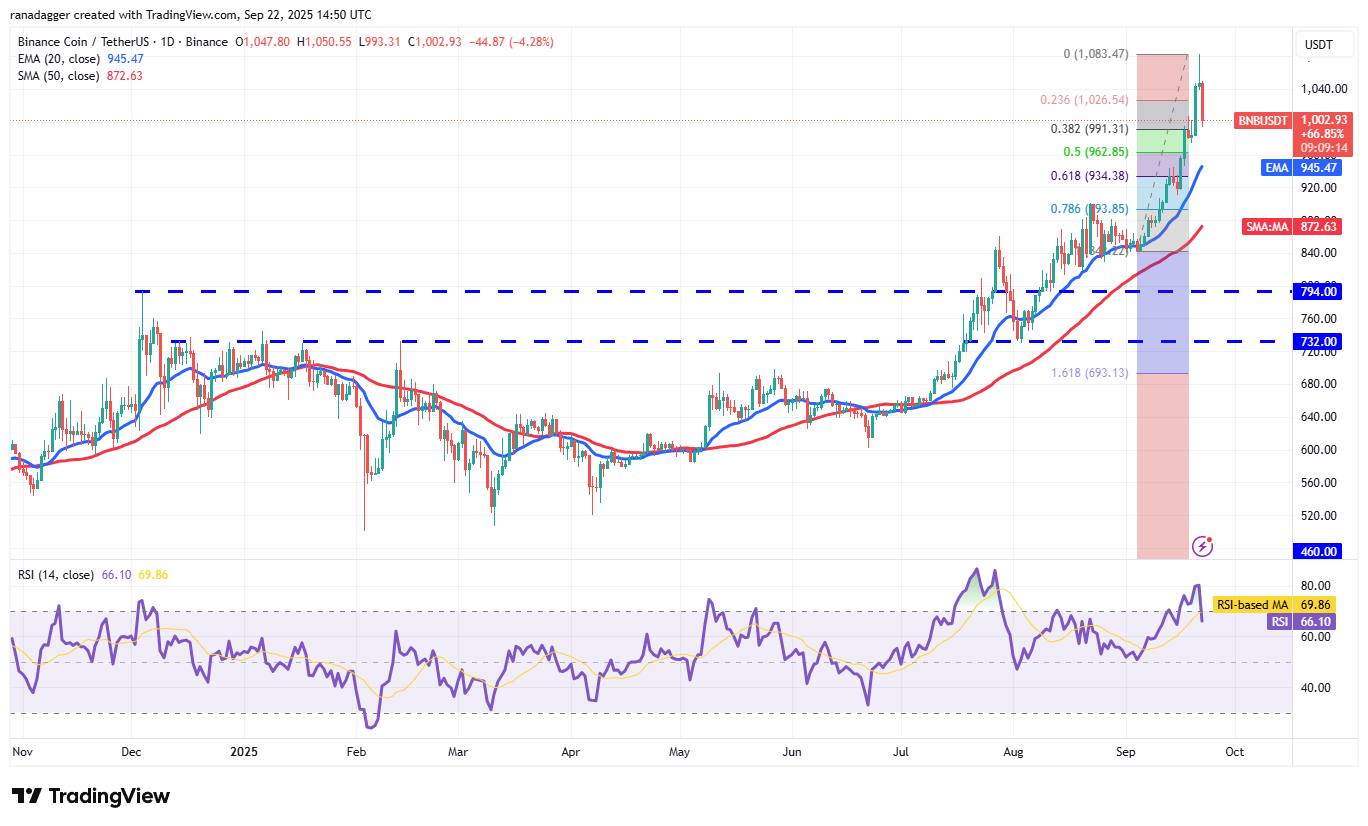
The BNB/USDT pair could pull back to the 20-day EMA ($945) if the support at the 38.2% Fibonacci retracement level of $991 cracks.
The BNB/USDT pair could pull back to the 20-day EMA ($945) if the support at the 38.2% Fibonacci retracement level of $991 cracks.
If the price rebounds off the 20-day EMA, it shows that the sentiment remains positive and traders are buying on dips. The bulls will then again try to resume the uptrend above $1,083. If they manage to do that, the BNB price could surge to $1,187.
If the price rebounds off the 20-day EMA, it shows that the sentiment remains positive and traders are buying on dips. The bulls will then again try to resume the uptrend above $1,083. If they manage to do that, the BNB price could surge to $1,187.
This positive view will be invalidated in the near term if the pair continues lower and breaks below the 61.8% retracement level of $934. The pair may then collapse to the 50-day SMA ($872).
This positive view will be invalidated in the near term if the pair continues lower and breaks below the 61.8% retracement level of $934. The pair may then collapse to the 50-day SMA ($872).
Solana price prediction
Solana price prediction
Solana (SOL) pulled back below the 20-day EMA ($227) and reached near the uptrend line, which is a crucial support to watch out for.
Solana (SOL) pulled back below the 20-day EMA ($227) and reached near the uptrend line, which is a crucial support to watch out for.
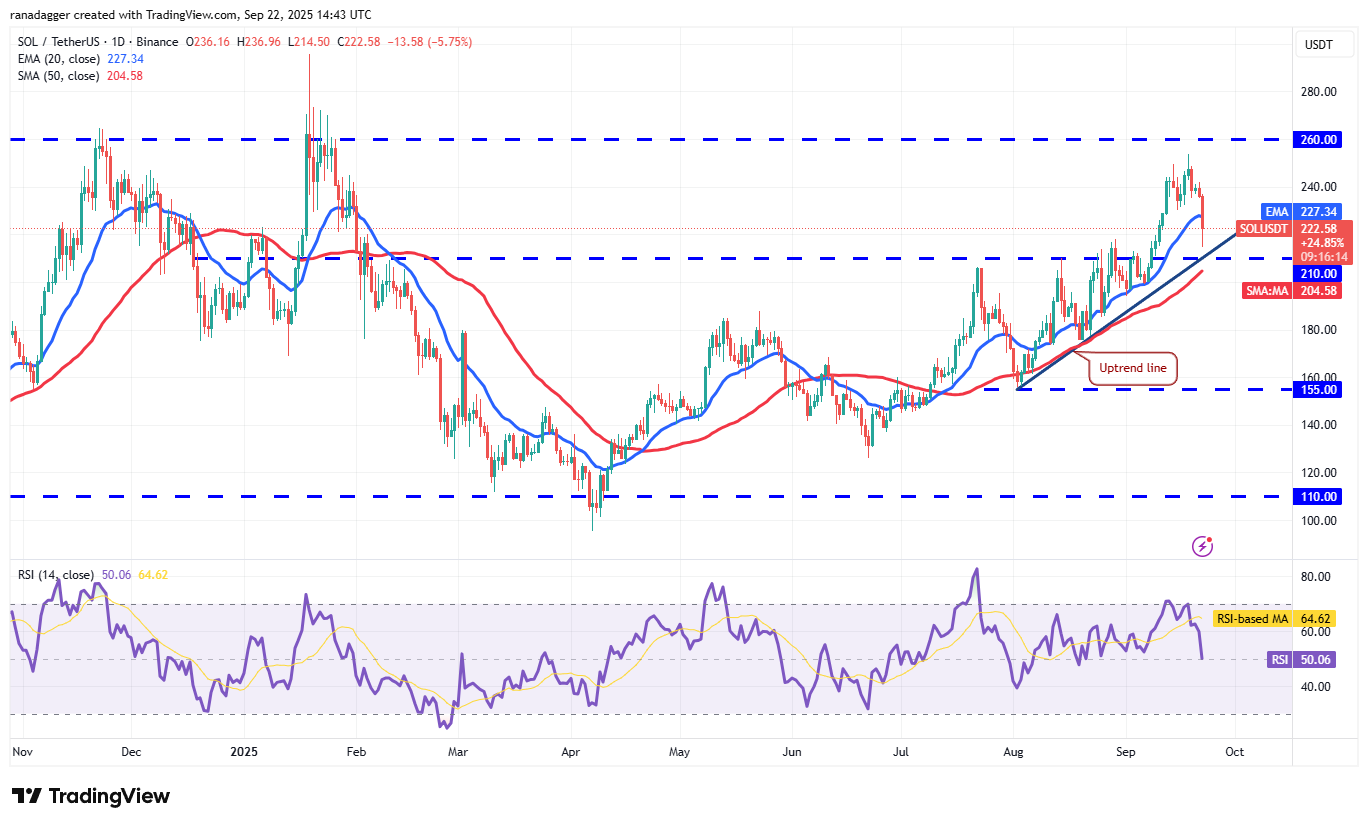
If the price rebounds off the uptrend line and rises above the 20-day EMA, it indicates solid buying on dips. The bulls will then strive to drive the SOL/USDT pair to the stiff overhead resistance at $260.
If the price rebounds off the uptrend line and rises above the 20-day EMA, it indicates solid buying on dips. The bulls will then strive to drive the SOL/USDT pair to the stiff overhead resistance at $260.
Contrarily, a break below the uptrend line suggests that the buying pressure is reducing. The Solana price may then drop to $185 and eventually to $155. That brings the large $110 to $260 range into play.
Contrarily, a break below the uptrend line suggests that the buying pressure is reducing. The Solana price may then drop to $185 and eventually to $155. That brings the large $110 to $260 range into play.
Related: Is XRP price going to crash after falling below $3 again?
Related: Is XRP price going to crash after falling below $3 again?
Dogecoin price prediction
Dogecoin price prediction
Dogecoin (DOGE) tumbled below the 20-day EMA ($0.25) on Monday, indicating that the bulls have given up.
Dogecoin (DOGE) tumbled below the 20-day EMA ($0.25) on Monday, indicating that the bulls have given up.
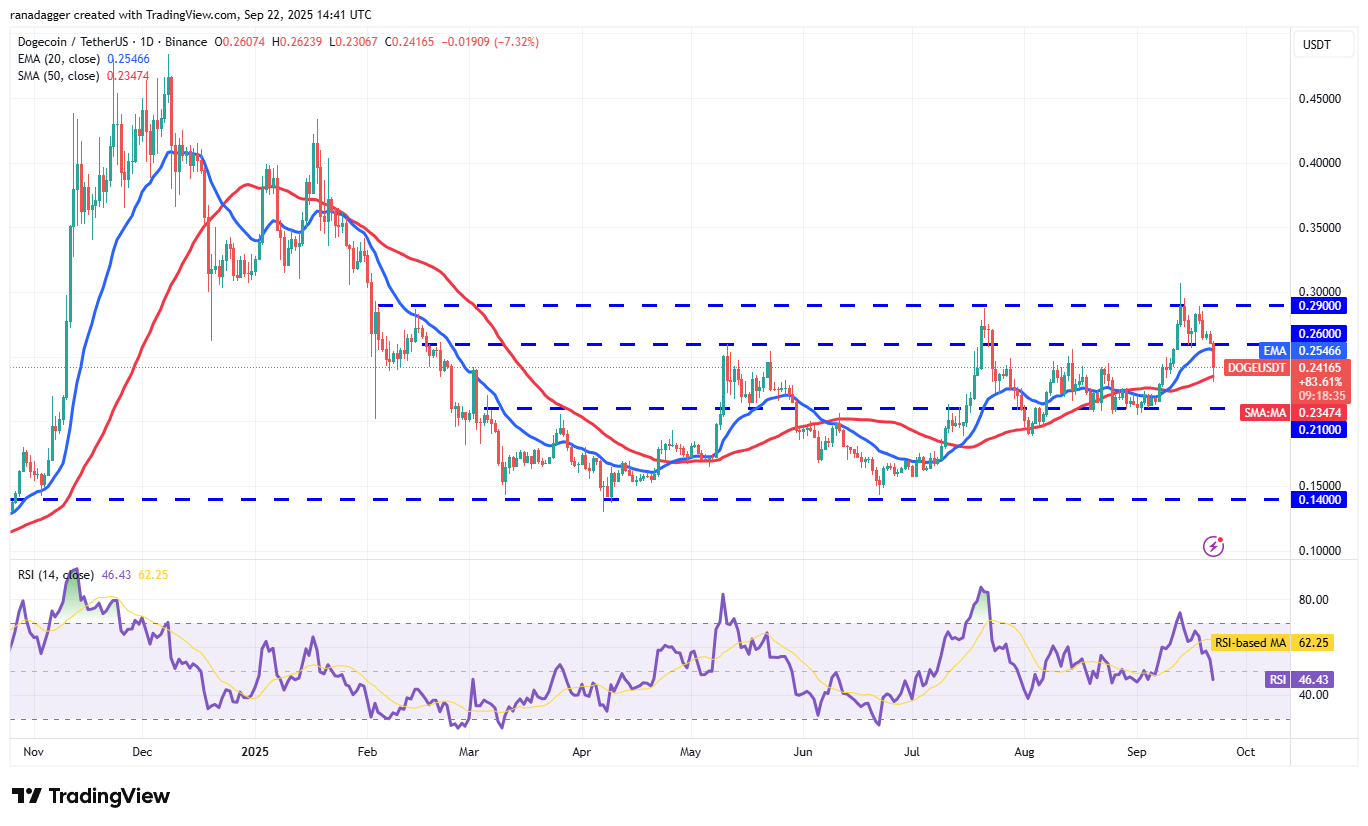
There is support at the 50-day SMA (0.23), but the level is likely to be broken. The DOGE/USDT pair may then slump to the solid support at $0.21. That suggests the Dogecoin price could remain inside the large $0.14 to $0.29 range for some more time.
There is support at the 50-day SMA (0.23), but the level is likely to be broken. The DOGE/USDT pair may then slump to the solid support at $0.21. That suggests the Dogecoin price could remain inside the large $0.14 to $0.29 range for some more time.
The bulls will have to push and maintain the price above the $0.29 resistance to gain the upper hand. The pair may then start a new uptrend toward $0.35 and, after that, to $0.44.
The bulls will have to push and maintain the price above the $0.29 resistance to gain the upper hand. The pair may then start a new uptrend toward $0.35 and, after that, to $0.44.
Cardano price prediction
Cardano price prediction
Cardano’s (ADA) symmetrical triangle pattern resolved to the downside on Monday, indicating an advantage to the bears.
Cardano’s (ADA) symmetrical triangle pattern resolved to the downside on Monday, indicating an advantage to the bears.
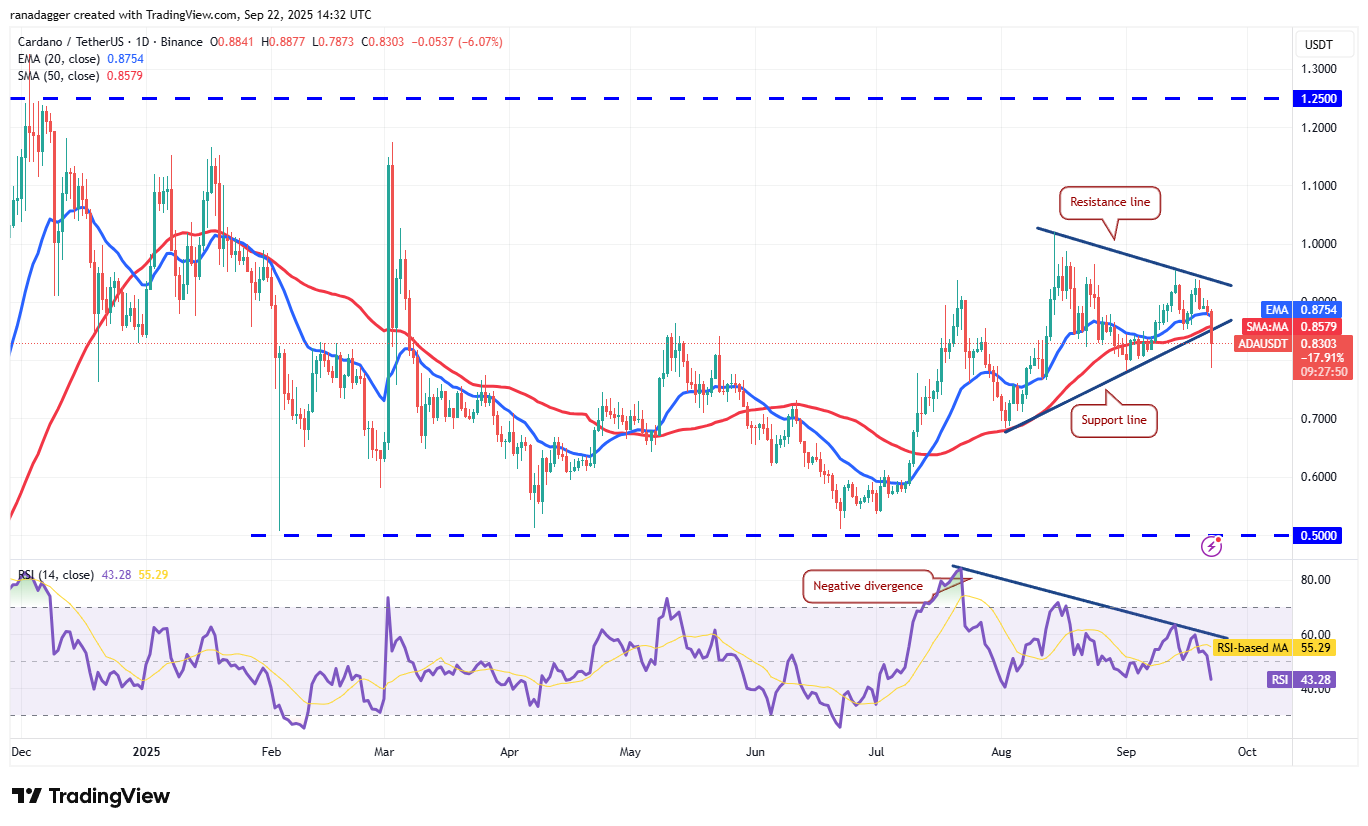
The bulls will try to push the Cardano price back into the triangle, but may face strong selling at the breakdown level. If the ADA/USDT pair turns down sharply from the moving averages and breaks below $0.78, it signals the start of a deeper correction to $0.68.
The bulls will try to push the Cardano price back into the triangle, but may face strong selling at the breakdown level. If the ADA/USDT pair turns down sharply from the moving averages and breaks below $0.78, it signals the start of a deeper correction to $0.68.
The first sign of strength will be a break and close above the moving averages. That shows solid buying at lower levels. The pair may start a new uptrend to $1.02 if buyers thrust the price above the resistance line.
The first sign of strength will be a break and close above the moving averages. That shows solid buying at lower levels. The pair may start a new uptrend to $1.02 if buyers thrust the price above the resistance line.
Hyperliquid price prediction
Hyperliquid price prediction
HYPE plunged below the 20-day EMA ($52.11) on Sunday, signaling that the bulls are rushing to the exit.
HYPE plunged below the 20-day EMA ($52.11) on Sunday, signaling that the bulls are rushing to the exit.
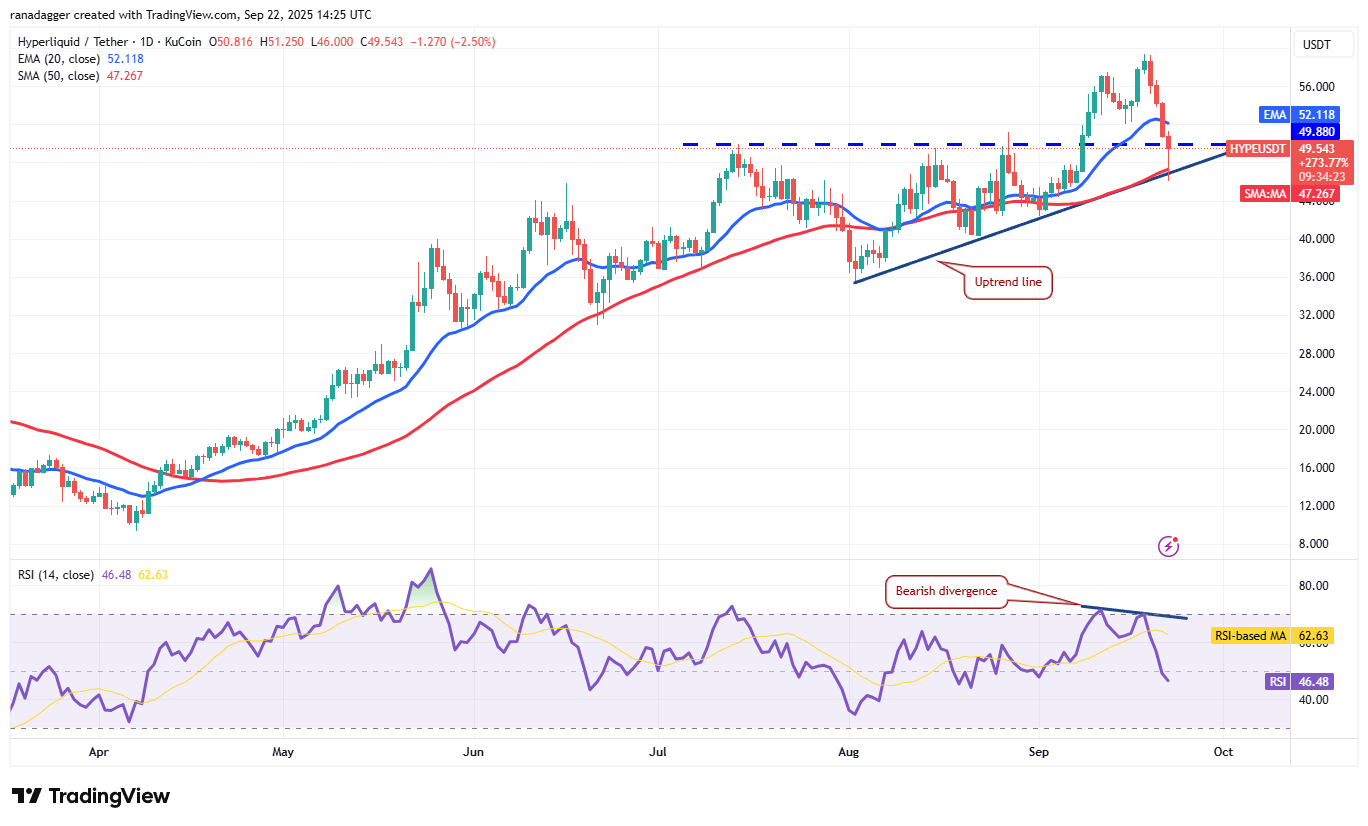
The HYPE/USDT pair reached the uptrend line, which attracted solid buying by the bulls as seen from the long tail on the day’s candlestick. Buyers will have to kick the price above the 20-day EMA to signal that the correction may be over.
The HYPE/USDT pair reached the uptrend line, which attracted solid buying by the bulls as seen from the long tail on the day’s candlestick. Buyers will have to kick the price above the 20-day EMA to signal that the correction may be over.
On the other hand, if the price turns down from the 20-day EMA and breaks below the uptrend line, it suggests that the bulls are losing their grip. The bears will then try to pull the Hyperliquid price to $40. Such a move indicates that the pair may have topped out in the short term.
On the other hand, if the price turns down from the 20-day EMA and breaks below the uptrend line, it suggests that the bulls are losing their grip. The bears will then try to pull the Hyperliquid price to $40. Such a move indicates that the pair may have topped out in the short term.
This article does not contain investment advice or recommendations. Every investment and trading move involves risk, and readers should conduct their own research when making a decision.
This article does not contain investment advice or recommendations. Every investment and trading move involves risk, and readers should conduct their own research when making a decision.
 Crypto Front News
 Coindoo
 CoinCryptoNews
 Coinlive.me
 Crypto Economy
 Coindoo.com
 Cointelegraph
 Crypto News Land
 BlockchainReporter


