

Dogecoin (DOGE) price's historical trend continues to capture significant attention within the crypto community. Analysts are observing a recurring pattern that suggests a potential surge towards the $1 mark.
Recent chart formations exhibit a structure reminiscent of previous bullish cycles, with technical and derivatives data showing promising signs of market positioning for upward movement.
Dogecoin Price Weekly Chart Forms Repetitive Pattern
Analysis of Dogecoin's weekly price chart by Trader Tardigrade reveals a consistent pattern of incremental and substantial price increases.
Each cycle typically begins with a modest pump, followed by a more pronounced rise that elevates the meme coin to a new level.
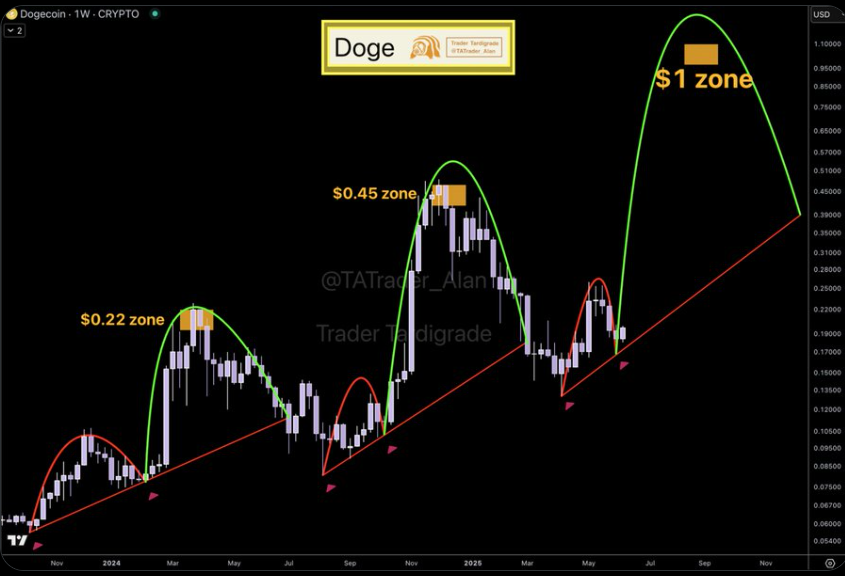
Notably, past trends showcase a breakout to $0.22 in early 2024, followed by a further climb to $0.45 later in the year. These movements occurred after a shorter-term upward wave and were supported by a rising trendline.
The latest DOGE price action aligns with this trendline, forming a base formation similar to those observed previously. The chart displays a pattern of pullbacks and rallies, where minor consolidations precede parabolic moves.
This consistency could be laying the groundwork for another expansion phase. Trader Tardigrade suggests that if this pattern persists, Dogecoin's price may be entering a setup consistent with previous rise-to-breakout sequences, potentially targeting the $1 region.
DOGE Price Monthly Chart Reinforces Long-Term Uptrend
Furthermore, Dogecoin's bullish long-term structure is reinforced by the monthly chart. In a separate analysis, Trader Tardigrade highlighted distinct breakouts following extended downtrends across three historical cycles.
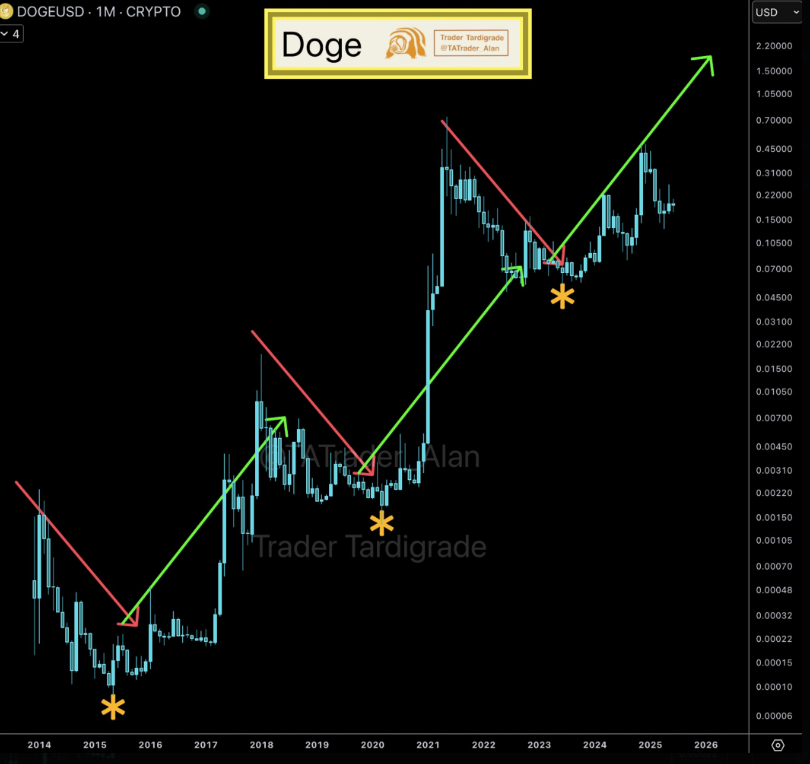
Each cycle commenced with a significant correction followed by a sharp recovery, sustaining upward momentum. Major reversal areas, indicated on the chart, mark the beginning of new bullish periods that unfold over several months.
The current monthly configuration mirrors the two previous cycles, with DOGE price currently undergoing a corrective period. Upward momentum appears to be regaining traction, supported by a green trendline tracing higher lows. This pattern of reversing from major lows into extended rallies has been a consistent feature since 2015.
As the latest bounce coincides with a similar formation, the meme coin could be poised for another multi-month surge, following the established historical trend.
Dogecoin Derivatives Data
Recent Dogecoin derivatives data from CoinGlass indicates a bullish continuation, particularly within the options sector. DOGE options volume has surged by 184.15%, and options open interest has increased by 64.75%.
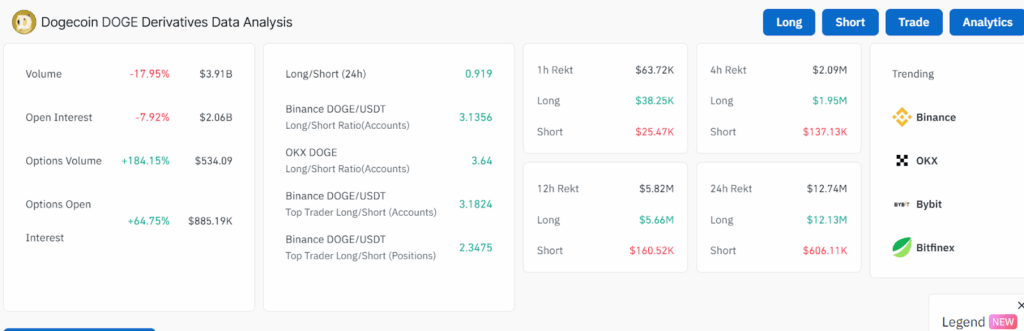
This surge correlates with increased speculative trading, suggesting traders are anticipating potential price movements.
While total trading volume decreased by 17.95% to $3.91 billion, and open interest fell to $2.06 billion, this suggests a reduction in leverage or a cooling-off period in futures activity.
Long/short ratios on major exchanges like Binance and OKX reveal that traders maintain a bullish bias. On OKX, the long/short ratio stands at 3.64, while Binance's top traders also exhibit a long bias, exceeding 3.0. In the past day, liquidations totaled $12.74 million, with $12.13 million attributed to long positions and $606K to short positions.
Recent analysis suggests Dogecoin price may be entering "Cycle 3" of its historical trend, characterized by a persistent pattern of consolidation followed by sharp rallies.
This scenario positions DOGE price to potentially target $10 in the long term. Positive indicators mirror previous breakouts, indicating the possibility of a new bullish cycle.
 AD HOC NEWS
 AD HOC NEWS
 Coinpaper
 Coinpaper
 Finance Feeds
 CryptoNewsLand
 Deythere
 36Crypto
 TurkishNY Radio


