

Cover image via U.Today
Bitcoin is currently experiencing a critical juncture, squeezed between two significant exponential moving averages (EMAs), resembling a classic price squeeze. While bulls may hold a slight edge, this chart tension suggests a potential volatility-driven breakout in either direction.
Bitcoin trades around $84,000, slightly above the 100-day EMA, but faces resistance from the 200-day EMA near $87,350. This narrow trading range indicates an imminent resolution. A decisive break above the 200-day EMA would negate the long-standing "death cross," signaling bullish momentum. 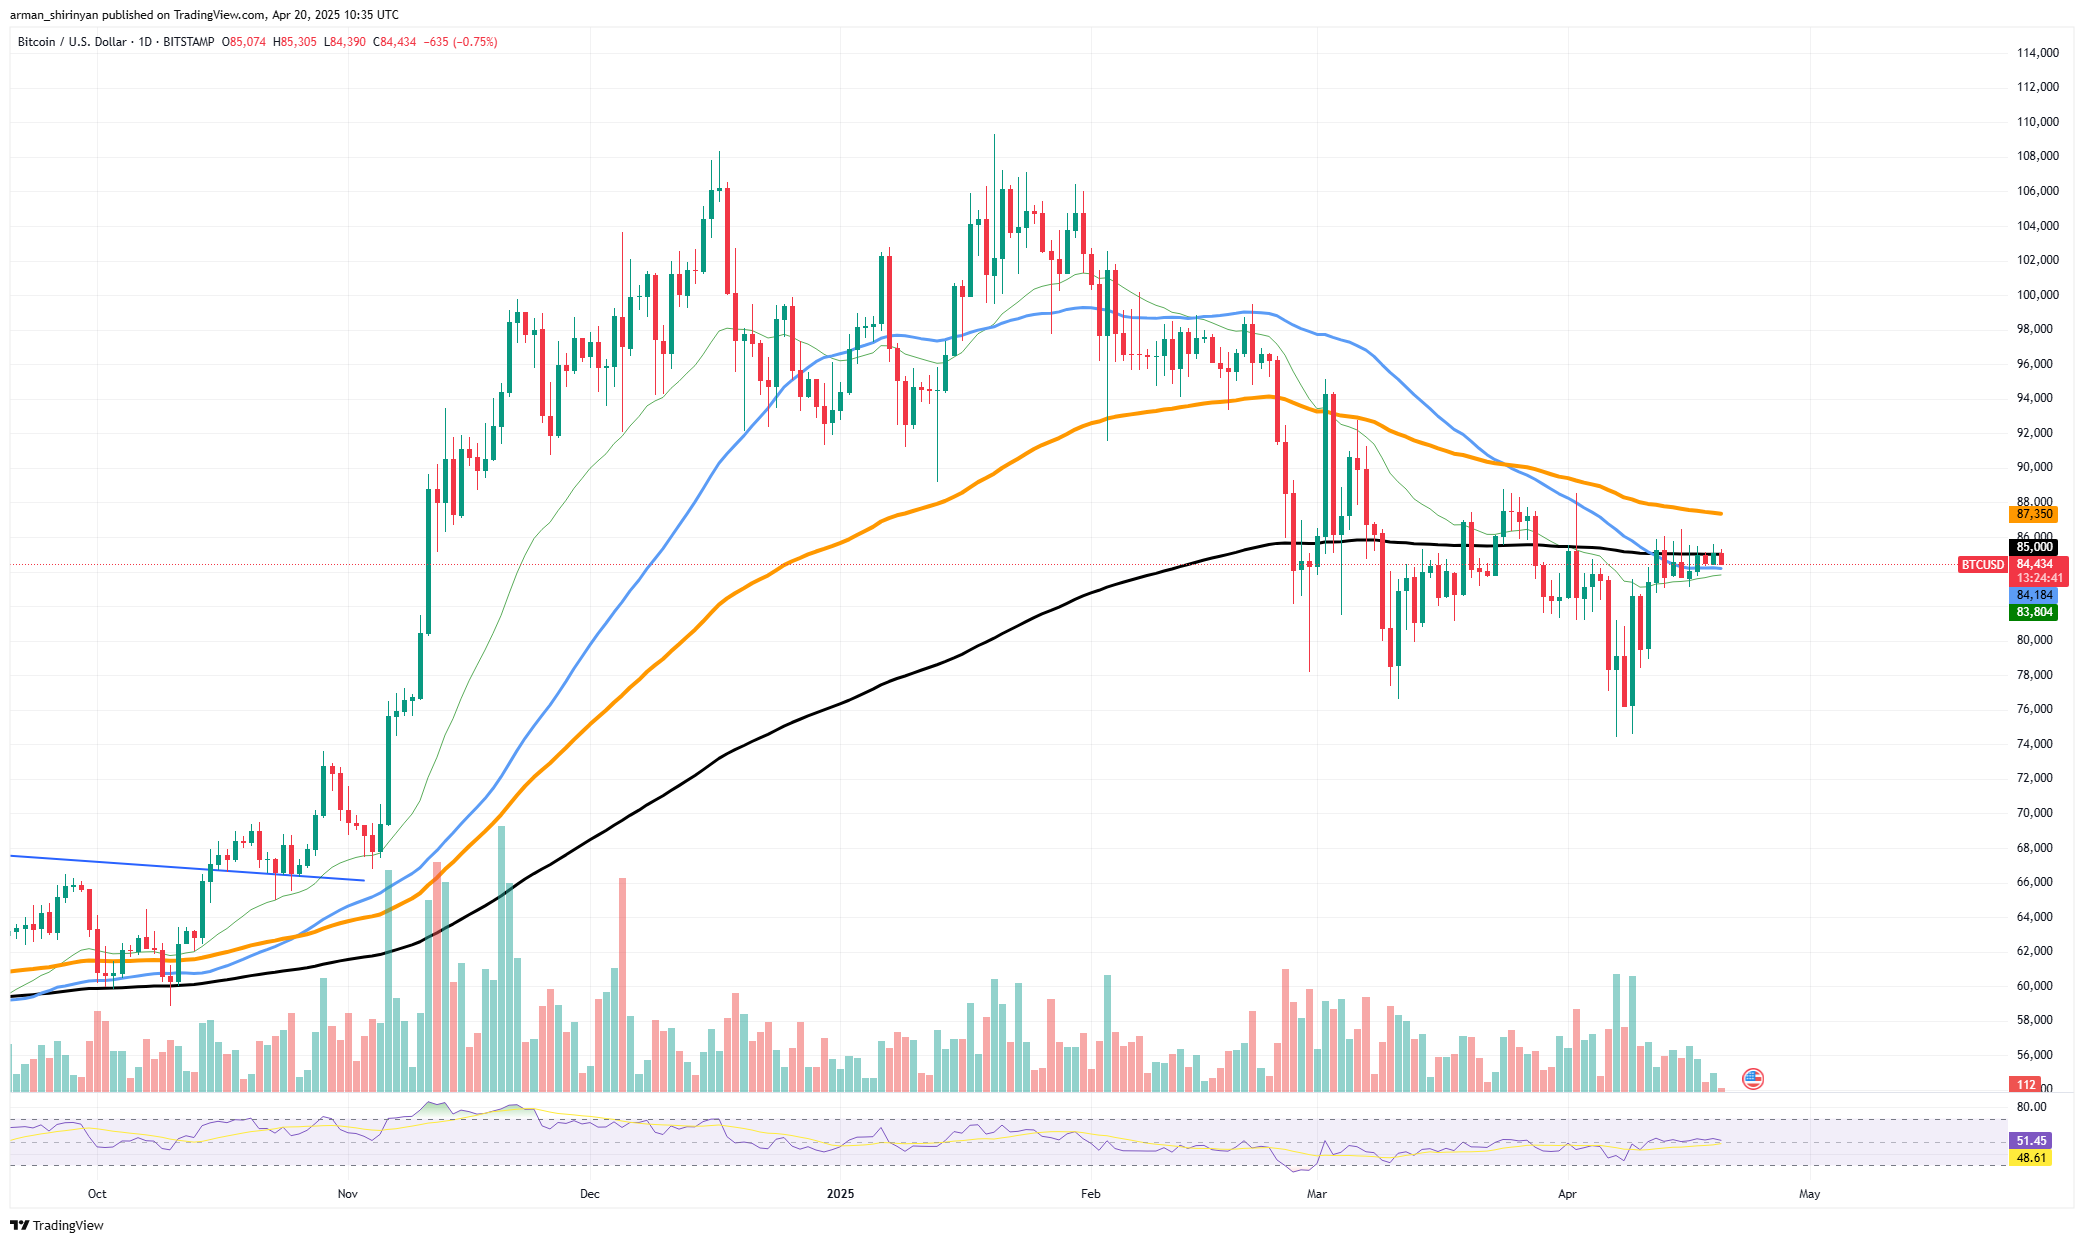
The chart's slightly declining volume often precedes a significant price movement. The RSI is neutral (around 51.5), neither overbought nor oversold, leaving room for traders to influence price action once a clear trend emerges.
A break above the 200-day EMA could trigger a short squeeze, potentially pushing prices towards $90,000 and beyond, reversing bearish sentiment and potentially initiating a new bull market. Conversely, failure to overcome resistance might lead to a rejection towards the $82,000–$83,000 support zone (where the 100-day EMA offers support). A break below this could result in further consolidation or correction.
Shiba Inu Faces Resistance
Shiba Inu is encountering significant resistance near the $0.0000122 level, struggling to break above the crucial 50-day EMA. Recent trading sessions show a failure to convincingly surpass this level. A sharp decline in volume further indicates waning market interest.
The chart reveals declining volume over recent weeks, suggesting either sidelined participants or diminishing interest, lacking conviction from both bulls and bears. Breakouts above the 50-day EMA are unlikely to sustain upward momentum without volume confirmation, as past breakouts without volume have quickly reversed. Shiba Inu's medium-term structure continues to show lower highs and lower lows, remaining within a broader downtrend. Even sporadic rallies from the $0.0000110–$0.0000115 support haven't established a stable base or attracted fresh capital.
The RSI is neutral, just below 50, offering no clear directional bias. Without restored volume and a confirmed close above the 50-day EMA, the path of least resistance remains sideways or downward.
Dogecoin's Waning Momentum
Dogecoin, once a retail favorite, is experiencing declining investor enthusiasm as its price performance deteriorates. Currently around $0.155, DOGE remains firmly in a bearish trend, failing to reclaim key moving averages since its last significant surge in late 2024, consistently posting lower highs.
Technically, DOGE struggles to surpass the 50-day EMA, a key indicator of short-term momentum. Declining volume and weakening sentiment make the 50-day and 100-day EMA resistance levels particularly challenging. Consolidation near $0.145 (just above critical support) is precarious without significant volume. The volume profile is concerning.
Amidst uncertain market conditions, investors are abandoning the meme coin, evidenced by steadily declining trading activity. Without fresh buying or a catalyst, Dogecoin may continue its decline or stagnate within a narrow, low-volatility range. The RSI hovers slightly above 40, well below the neutral 50, confirming bearish territory and a lack of momentum.
This reinforces waning investor confidence. A sustained break above the $0.165–$0.18 range, ideally with increased volume, is needed for DOGE to regain bullish momentum. Until then, further gradual decline is expected as investor interest continues to fade. Read original article on U.Today
 Coinpaper
 Finance Feeds
 CryptoNewsLand
 Deythere
 36Crypto
 TurkishNY Radio
 Bitcoin Sistemi
 CoinoMedia
 Yellow News


