

TL;DR: Unsure if the crypto market is bullish or bearish? This guide helps you differentiate between bull and bear markets using price action, volume, sentiment, and on-chain data. Learn to identify market cycles, key signals, and adapt your trading strategy accordingly for smarter trading decisions.
Crypto markets are notoriously volatile, with prices fluctuating wildly. Determining whether the market is bullish or bearish is crucial for informed trading.
Simply put:
A bull market is characterized by consistently rising prices, widespread enthusiasm, and optimistic market sentiment. The late 2020 and early 2021 Bitcoin (BTC) surge from ~$10,000 to nearly $70,000 exemplifies this, marked by numerous new project launches and widespread crypto adoption.
Conversely, a bear market features sustained price declines, investor withdrawal, and negative sentiment. The 2022 market crash, with Bitcoin falling below $20,000 and significant project failures (like Terra), serves as a prime example.
Understanding the prevailing market condition is vital for strategic trading. It prevents impulsive decisions like investing in memecoins during downturns or panic-selling before potential rebounds. Recognizing market phases allows for better risk management and emotional control, crucial aspects of successful crypto trading.
Historically, the term "bear market" originated from 18th-century England, where "bearskin jobbers" were early short-sellers. The expression "don't sell the bear's skin before you've caught the bear" highlights the risk of short-selling. The term "bull market" followed, representing the opposite, mirroring the upward thrust of a bull's horns.
Understanding Bull and Bear Market Cycles
Crypto markets are more than just numbers; they reflect narratives, headlines, and the evolving sentiment of entire communities. Here's how to understand bull and bear cycles:
Bull Market Characteristics:
a) Sustained Price Increases: Prices consistently rise over extended periods (weeks or months). Major and altcoins experience sustained growth. Bitcoin's 2020-2021 rally and Dogecoin's early 2021 surge are classic examples.
b) Positive Investor Sentiment: Euphoria prevails, with widespread anticipation of further price increases and numerous new project launches. Rapid capital inflows and a willingness to take on risk are common.
c) Favorable Economic Indicators: Often coincides with low interest rates, easy credit access, and generally positive economic conditions. The 2020 bull run benefited from pandemic-era stimulus and low borrowing costs.
Bear Market Characteristics:
a) Prolonged Price Declines: Prices experience extended and significant drops, with minor rebounds quickly sold off. The 2018 "crypto winter" and the 2022 downturn, fueled by events like the Terra-Luna collapse and FTX scandal, illustrate this.
b) Negative Investor Sentiment: Fear dominates, characterized by negative headlines, reduced social media activity, and diminished investor confidence. Funding dries up, and project development slows.
c) Adverse Economic Conditions: Macroeconomic factors like high interest rates, inflation, and tightening monetary policy exacerbate the downturn. The 2022 bear market was influenced by the Federal Reserve's aggressive rate hikes.
Key Indicators for Identifying Market Phases
While no single indicator guarantees perfect market prediction, several reliable indicators help assess market conditions:
- Trading Volume: High volume during price increases signifies strong buyer conviction (bullish), while low volume during price drops indicates weak buying pressure (bearish). Dogecoin's 2021 surge saw nearly $70 billion traded in a single day.
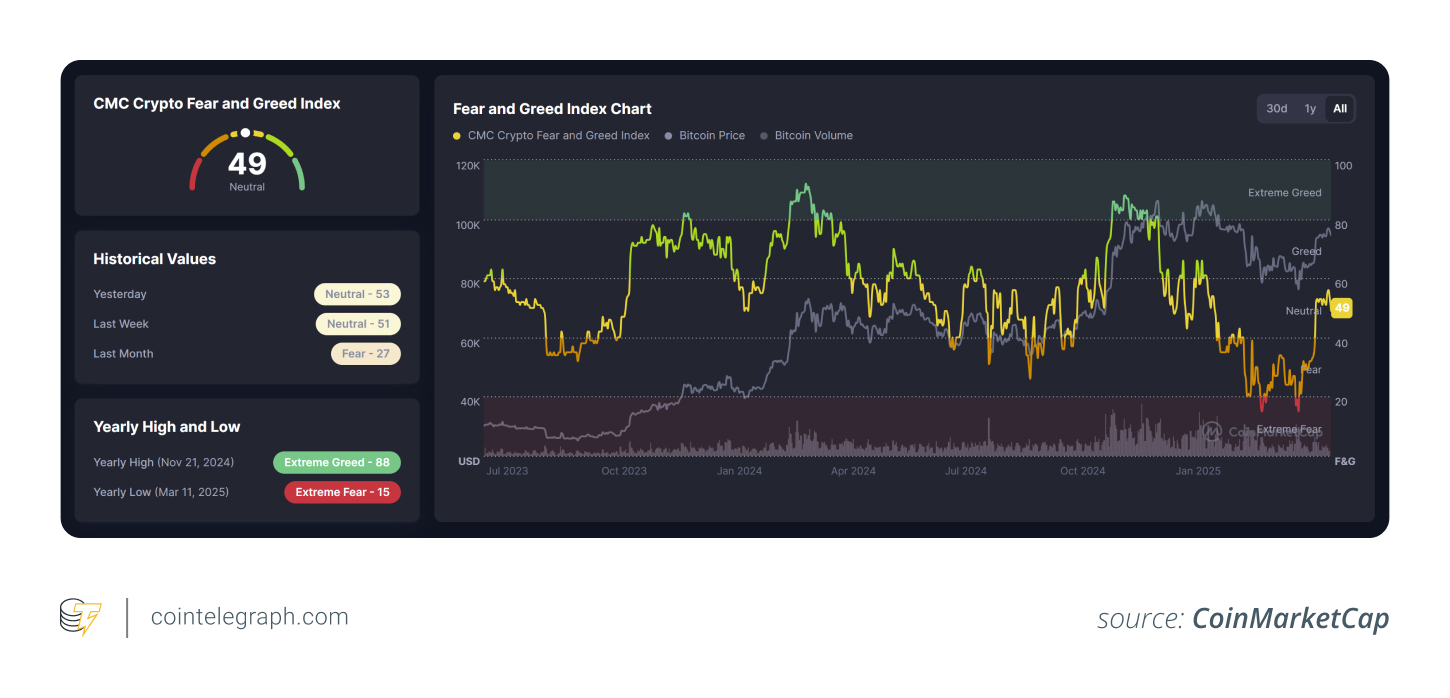
- Market Sentiment: Tools like the Crypto Fear & Greed Index track social media activity, volatility, and search trends to gauge investor sentiment. Extreme greed often signals market tops, while extreme fear can indicate market bottoms. Use it as a gauge, not a definitive prediction.
Technical Indicators:
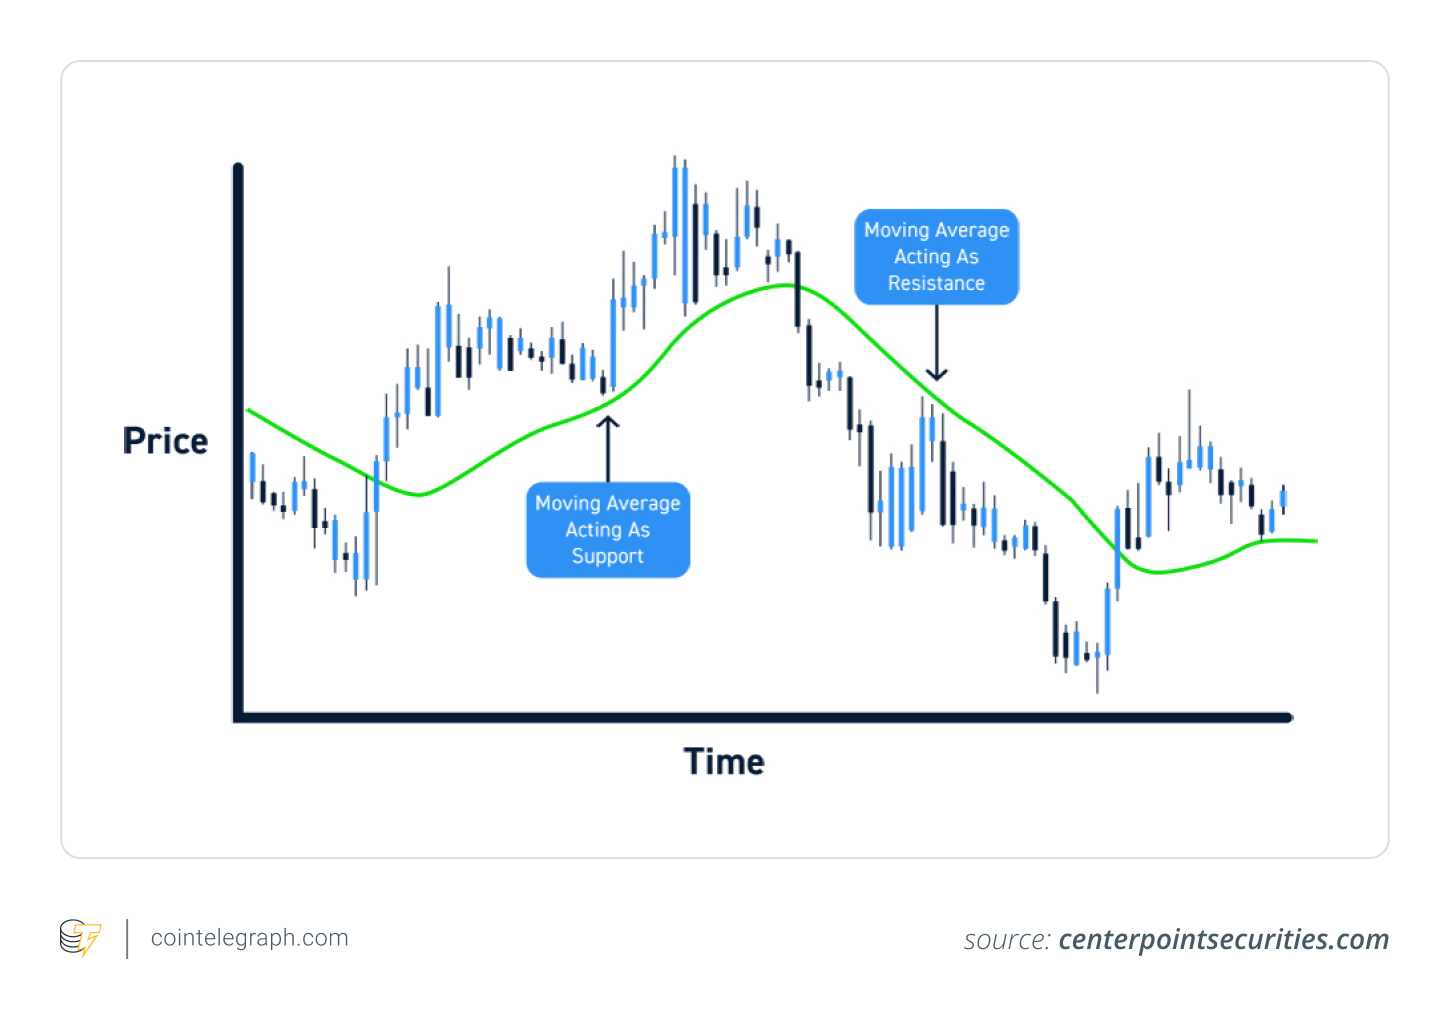
- Moving Averages: A price consistently above the 200-day moving average is generally bullish; below it suggests a bearish trend. These are long-term indicators.
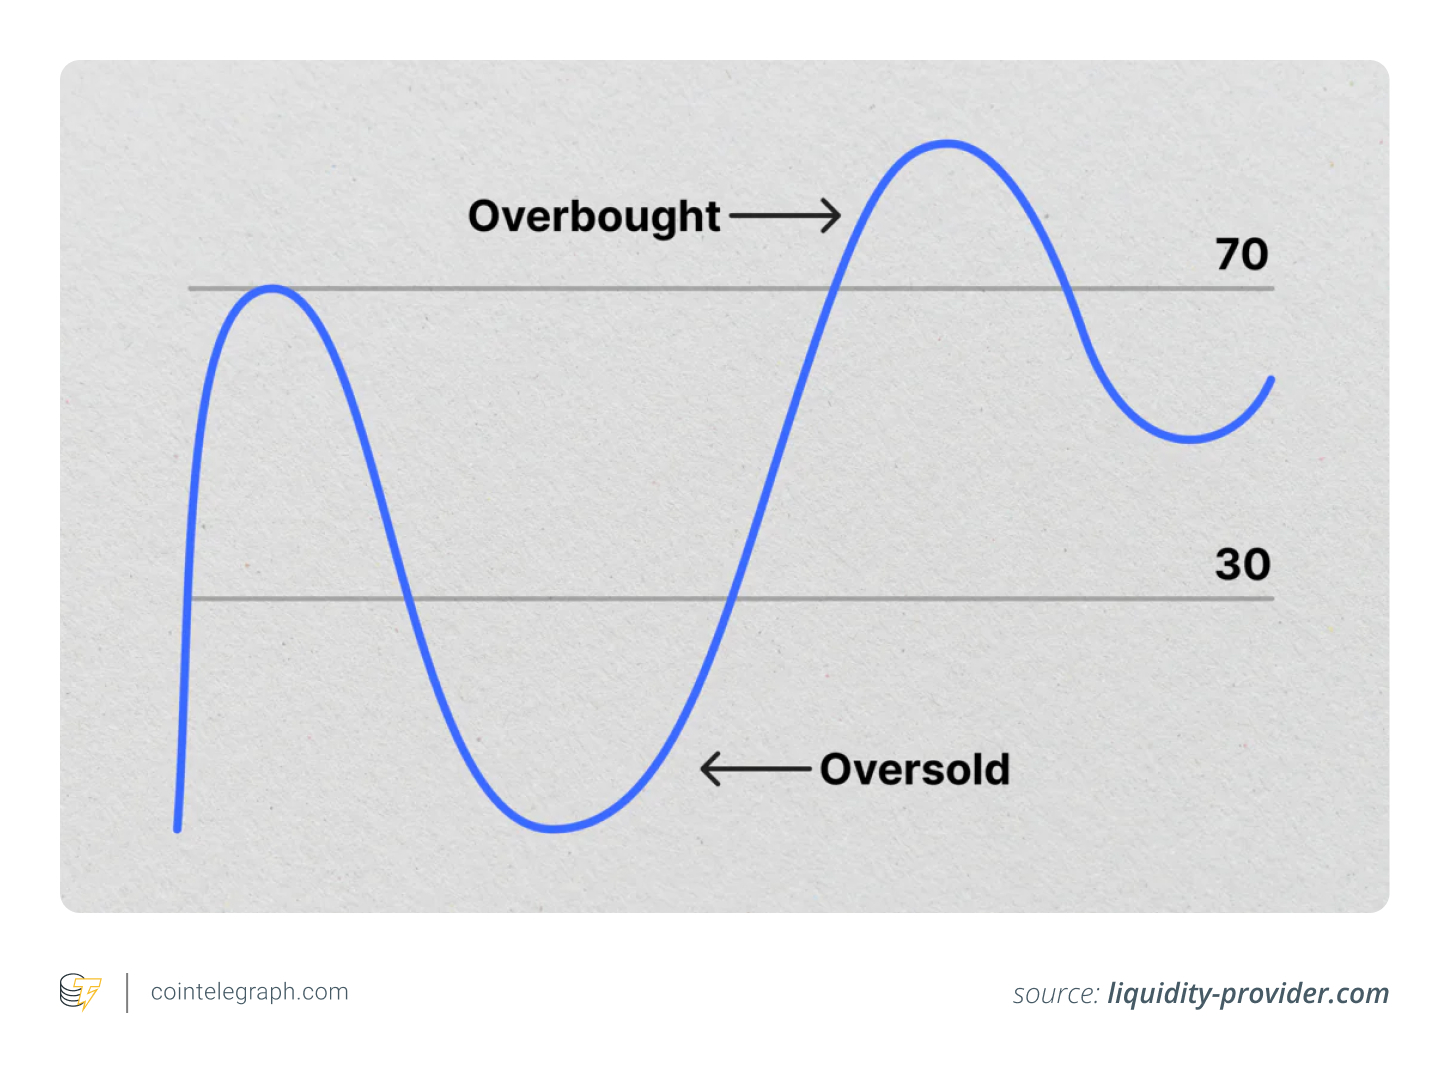
- Relative Strength Index (RSI): Measures whether an asset is overbought (above 70) or oversold (below 30).
Fundamental Factors: Events outside price charts influence markets.
- Bullish: Institutional adoption, positive regulatory news, and significant technological advancements.
- Bearish: Regulatory crackdowns, security breaches, and global economic instability.
Utilizing Available Resources
Several tools assist in market analysis:
- Charting Platforms: TradingView and Cointelegraph provide comprehensive charting tools and market data.
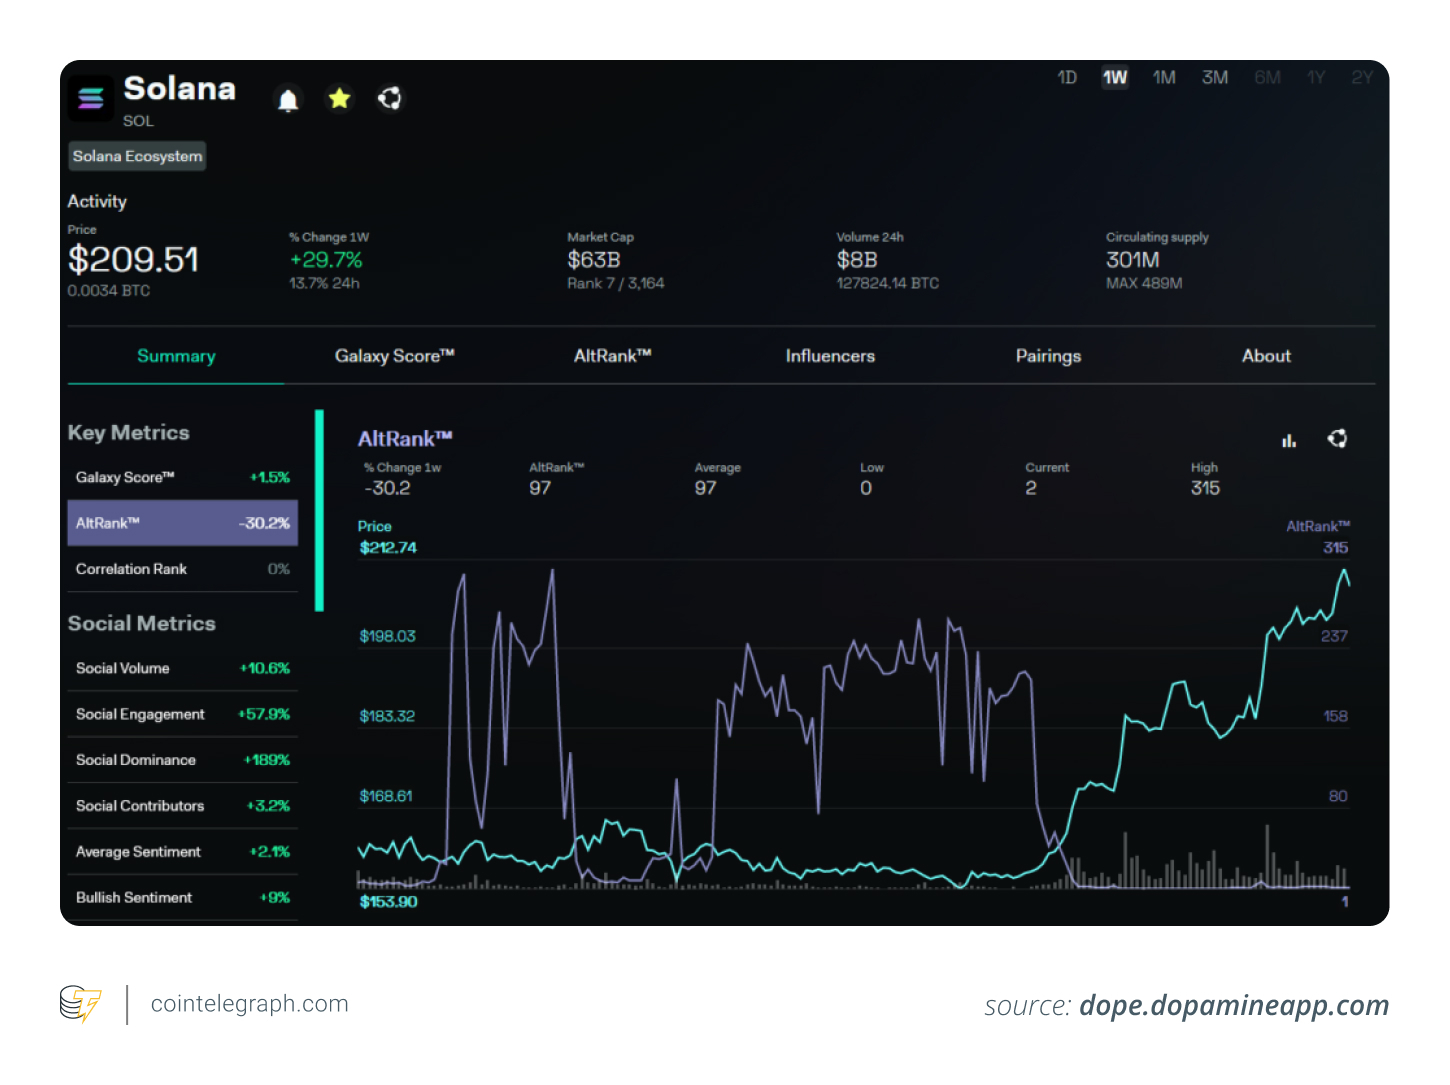
- Sentiment Analysis: Platforms like LunarCrush monitor social media sentiment and identify trending tokens.
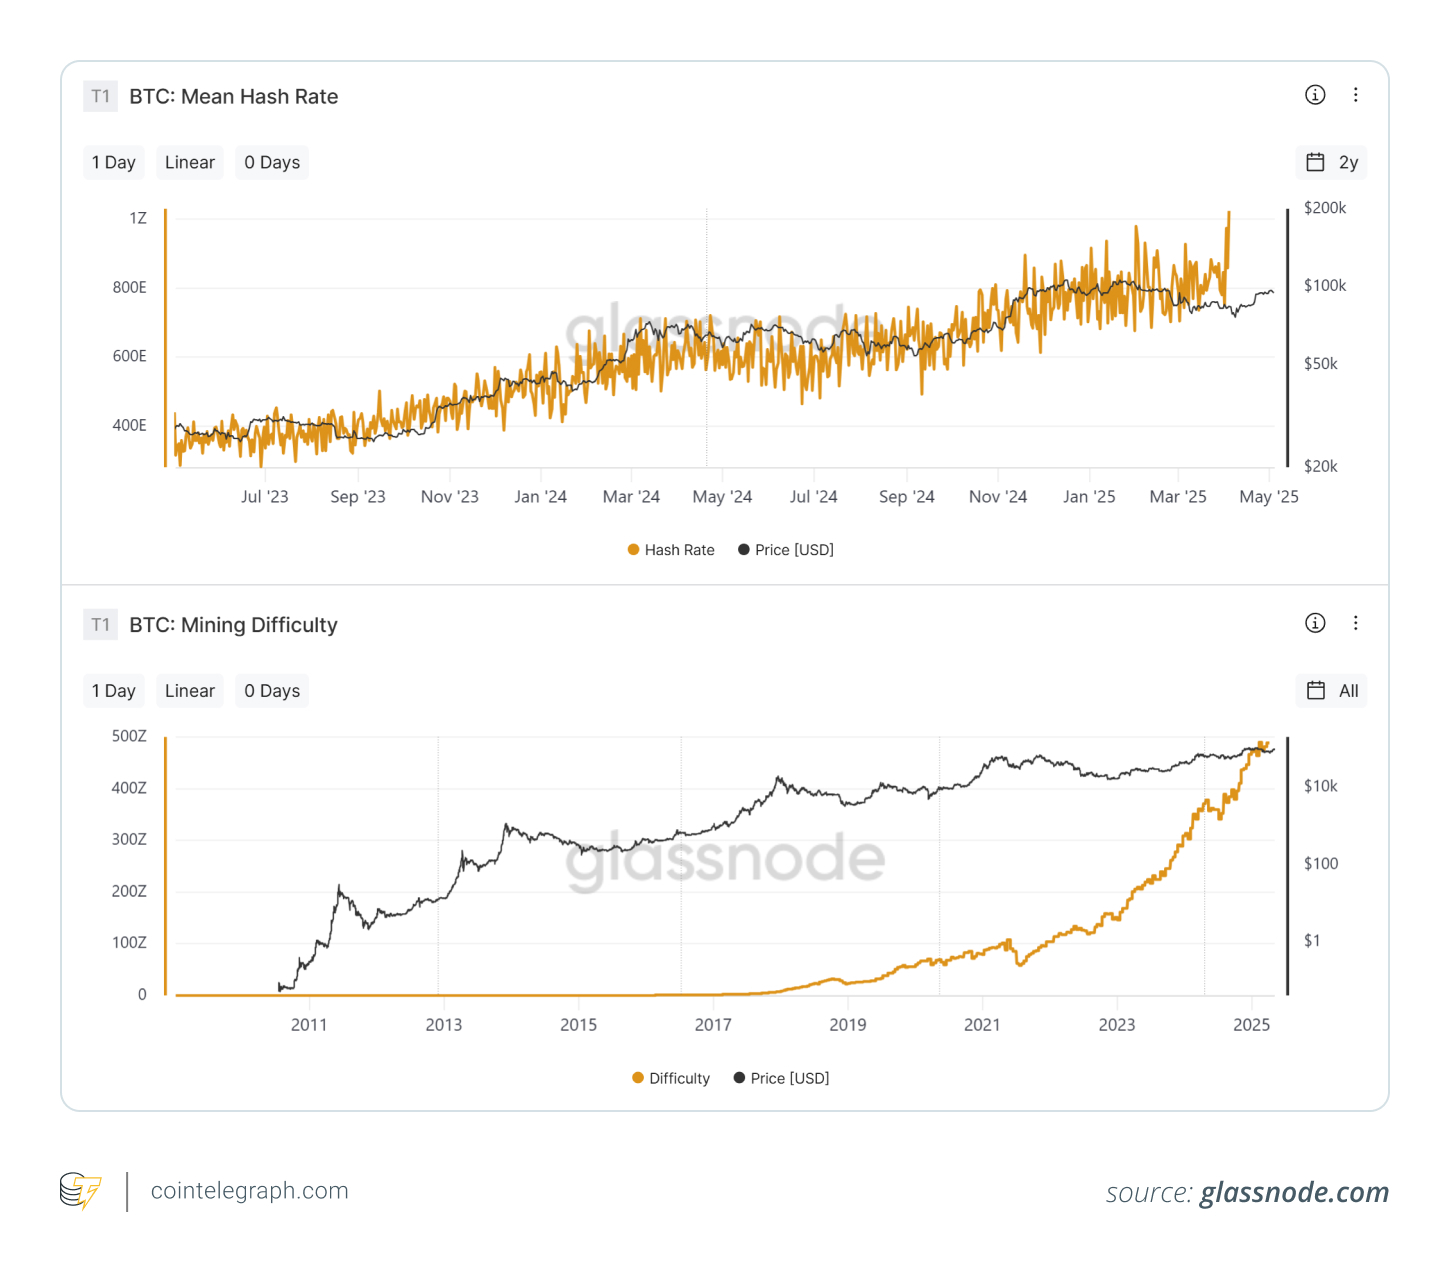
- On-Chain Data: Glassnode and CryptoQuant offer insights into wallet flows, miner activity, and exchange balances, providing early warnings of capital shifts.
Strategies for Navigating Market Conditions
Your trading strategy should adapt to market conditions:
Bull Market Strategies:
- Trend Following: Capitalize on uptrends, but maintain discipline.
- Profit-Taking: Set profit targets and adhere to them.
- Risk Management: Use stop-losses to protect gains.
Bear Market Strategies:
- Defensive Positioning: Shift to stablecoins or less volatile assets.
- Dollar-Cost Averaging (DCA): Regularly invest to reduce average cost.
- Focus on Fundamentals: Invest in projects with strong fundamentals.
Conclusion
Crypto markets are dynamic, but understanding market cycles and utilizing available tools allows for informed decision-making. Preparation is key to navigating both bull and bear markets successfully.
Disclaimer: This article is for informational purposes only and does not constitute investment advice. All investment decisions involve risk, and readers should conduct their own thorough research.
 Coinpaper
 Finance Feeds
 CryptoNewsLand
 Deythere
 36Crypto
 TurkishNY Radio
 Bitcoin Sistemi
 CoinoMedia
 Yellow News


