

Dogecoin (DOGE) is exhibiting resilience, maintaining price support around the $0.168 level, a critical zone for buyers. Each dip into this area is met with support, aided by a rising Relative Strength Index (RSI) that suggests a hidden bullish divergence.
Technical Support Zone Remains Key
Analysis indicates that Dogecoin consistently rebounds from this support range. The RSI trendline is proving crucial in preventing further price declines below $0.168. The upward movement of RSI lows, forming higher lows, hints at underlying bullish momentum.
The RSI currently hovers above 50, presenting a neutral outlook with potential for upward movement. DOGE is trading near $0.177, above the Fair Value Gap and 4-hour Order Block, positioning it strategically within the $0.176-$0.178 range.
Increased trading volume further supports a potential bullish continuation. Data reveals a significant rise in trading volume, coupled with substantial on-chain activity, including a large DOGE transfer exceeding $21 million. This could signify accumulation and bullish intent from larger holders.
Chart Patterns Suggest Potential Breakout
DOGE continues to trade within a symmetrical triangle formed since early February, with the current price near the lower boundary. Maintaining the $0.168 level is considered crucial; a breach could lead to significant declines.
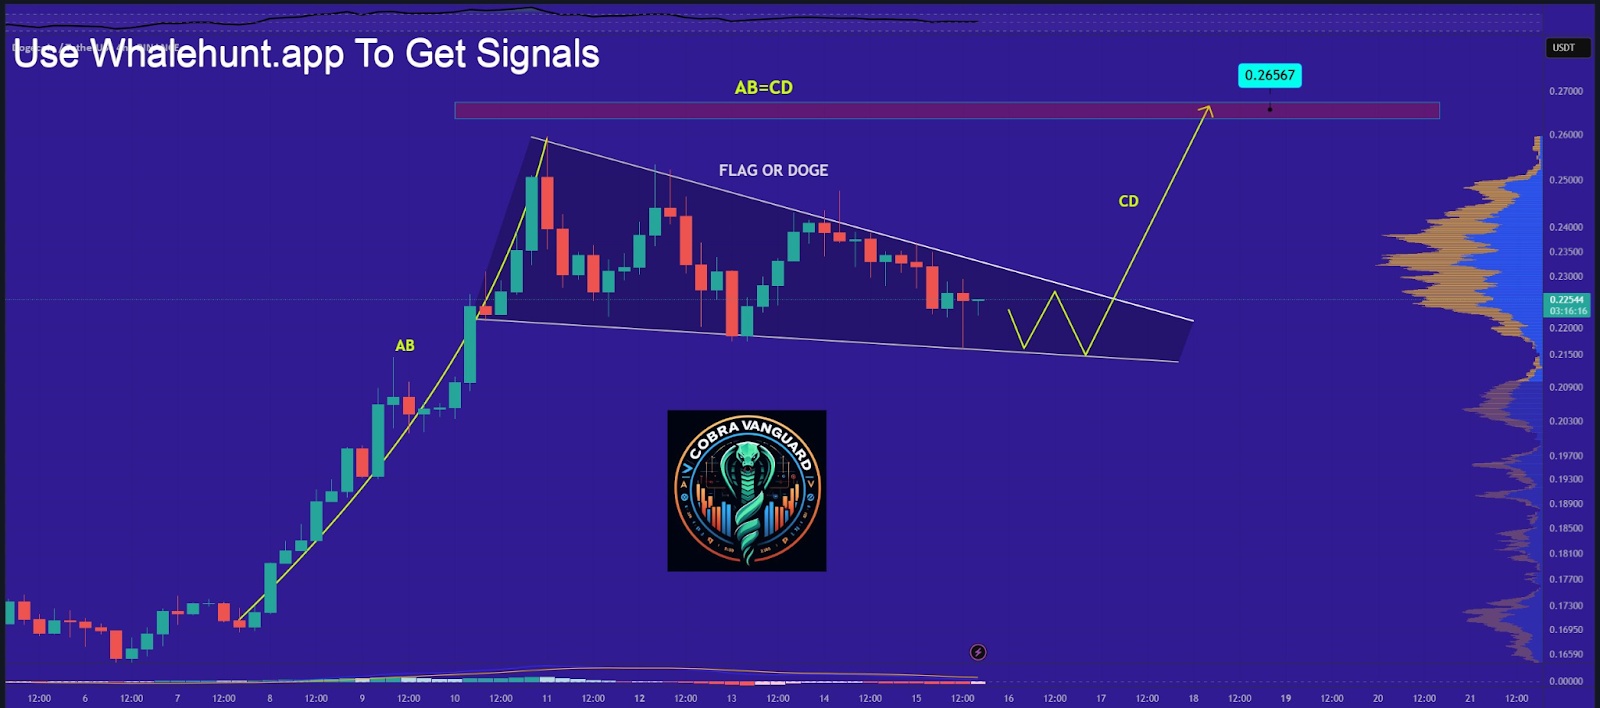
Furthermore, an ascending flag pattern has been identified on the DOGE chart, suggesting a potential upward movement upon breakout.
As of June 16, Dogecoin is consolidating between $0.175 and $0.18. Traders are closely monitoring for a breakout, particularly given the higher lows forming on the RSI. Potential targets following a breakout include $0.21 and $0.24, according to recent analyst forecasts.
 AD HOC NEWS
 AD HOC NEWS
 Coinpaper
 Coinpaper
 Finance Feeds
 CryptoNewsLand
 Deythere
 36Crypto
 TurkishNY Radio


