

Dogecoin (DOGE) has shown resilience, bouncing off the $0.13 support level, which aligns with the 0.618 Fibonacci retracement level. This bounce occurred near a long-term trendline established in late 2023, suggesting underlying strength.
A weekly close above $0.17 could propel DOGE towards targets of $0.21 and $0.29, based on Fibonacci retracement levels. However, current technical indicators present a mixed signal as DOGE retests trendline resistance. The market awaits confirmation of a sustained bullish trend.
Dogecoin is currently trading at a crucial resistance zone after a rebound from significant support. The price structure suggests a decisive breakout may be imminent.
Key Support Levels
Analyst Ali_charts (@ali_charts) highlighted that a weekly close above $0.17 could drive DOGE to $0.21, potentially reaching $0.29, provided the $0.13 support holds. This aligns with recent engagement with key technical levels, providing investors with important price points to monitor.
Dogecoin was trading at approximately $0.1603 at the time of writing, representing a 6.47% increase over the past seven days. On larger timeframes, DOGE has respected an upward trendline. A recent dip to around $0.128 saw a clean rebound from this trendline, coinciding with the 0.618 Fibonacci retracement level, reinforcing its significance as support.
Technical analysis suggests DOGE's correction from its early 2025 peak of $0.485 may be entering a consolidation phase. Fibonacci levels, calculated using the swing low of $0.056 and the high of $0.485, indicate resistance at $0.187 (0.5 level), $0.217 (0.382 level), and $0.29 (0.236 level).
Mixed Momentum Signals
The daily chart shows DOGE recently fell below its uptrend line and is currently testing it from below. The price is struggling around $0.16, near the trendline's base. Reclaiming this line would be a significant bullish signal.
The Moving Average Convergence Divergence (MACD) shows a weak bullish crossover, slightly above the signal line with a flat histogram. This indicates weak momentum and potential market indecision.
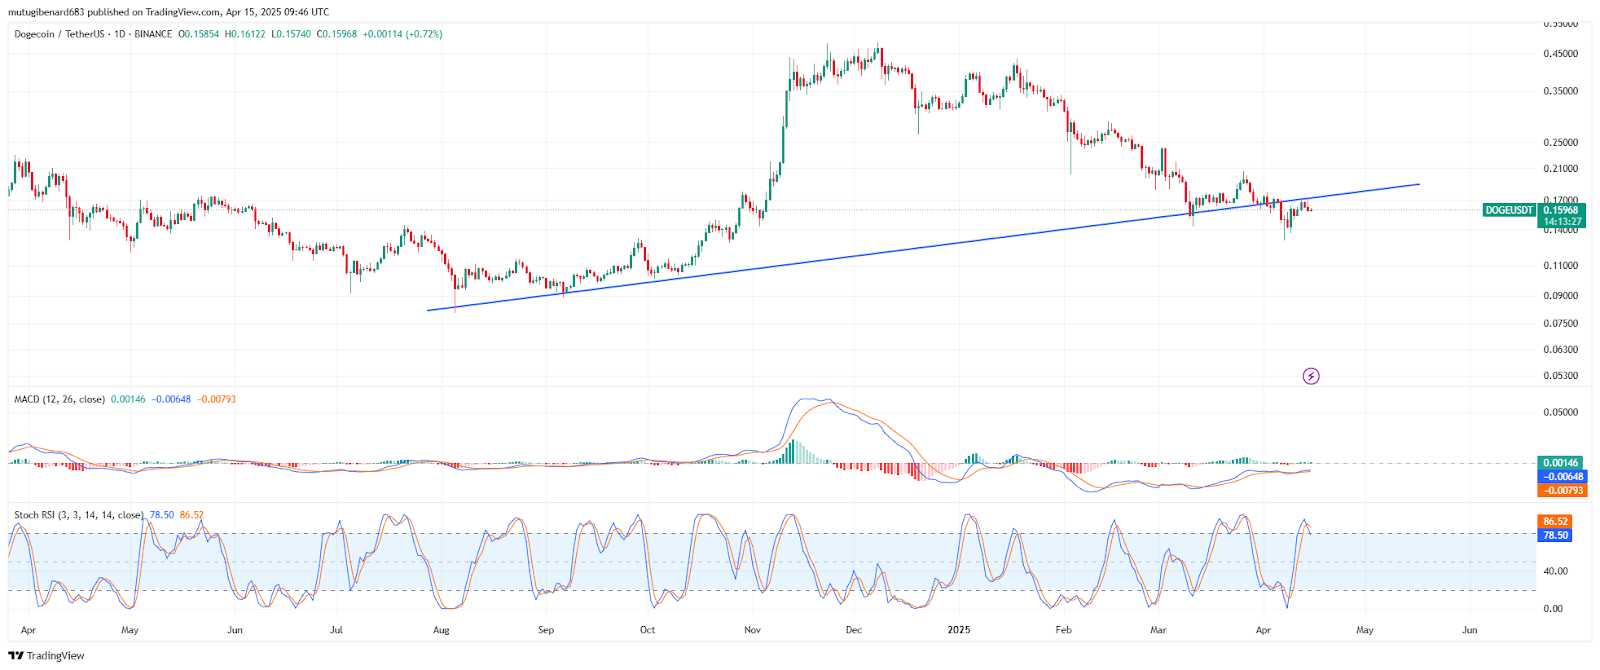
Source: TradingView
The stochastic oscillator is in overbought territory, above 80. Both %K and %D are nearing a bearish convergence, which could trigger a short-term correction, especially if DOGE fails to break through trendline resistance.
Major Resistance, Support Levels, and Outlook
DOGE faces resistance at $0.17 and $0.187. Breaking above these levels could pave the way for a move towards $0.21 and $0.29, aligning with Fibonacci retracement levels. Conversely, a break below the current trendline could lead to further selling pressure.
The $0.13 support zone remains crucial. A break below this level would invalidate the bullish setup and potentially open the door to lower support levels.
Traders are closely monitoring DOGE's current technical juncture, awaiting confirmation of either a breakout or breakdown in upcoming trading sessions.
 Coinpaper
 Finance Feeds
 CryptoNewsLand
 Deythere
 36Crypto
 TurkishNY Radio
 Bitcoin Sistemi
 CoinoMedia
 Yellow News


