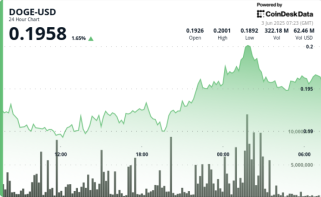
Dogecoin (DOGE) shows potential for a breakout as bullish sentiment strengthens among traders. Currently, the memecoin is trading above its key support level of $0.17, with technical indicators suggesting a possible test of higher resistance levels.
Bullish Sentiment from the Long/Short Ratio
Dogecoin's Long/Short Ratio jumped from 0.85 to 1.20 in the last 24 hours—its highest point in a week. This indicates a surge in traders betting on DOGE's price increase, signifying growing confidence in a potential upward trend. Historically, Dogecoin's price responds positively when this ratio surpasses 1.00, often preceding breakout attempts. This also suggests a renewed speculative interest in DOGE.
Dogecoin's Technical Analysis
From a weekly perspective, Dogecoin remains within a long-term ascending channel, holding above crucial diagonal support near $0.17. Fibonacci extensions project resistance zones at $0.22 and $0.23; breaking above these could potentially lead to a price target of $0.30.
Key technical levels are:
- Immediate Resistance: $0.182 (50 EMA)
- Next Resistance: $0.22–$0.23 (2.618 and 3.618 Fib extensions)
- Critical Support: $0.16, with potential downside risk to $0.15 if breached.
Momentum Indicators Suggest a Neutral to Bullish Outlook
Dogecoin's RSI currently stands at 50, indicating a neutral market sentiment. However, stable sideways price action near $0.175, coupled with narrowing Bollinger Bands and a flat MACD, suggests a potential build-up for a significant price movement.
DOGE's Future Outlook
With Dogecoin holding above $0.17 and bullish sentiment rising, the next crucial test lies at the $0.22–$0.23 resistance. Increased trading volume could propel DOGE towards $0.30.
Traders should carefully monitor sentiment, volume, and key support levels. Given the volatility inherent in memecoins, caution is advised in case of unexpected price corrections.
 CoinDesk
 Cryptopolitan
 https://www.facebook.com/Coinpedia.org
 https://www.facebook.com/Coinpedia.org