

Dogecoin is currently trading within a long-term ascending channel, supported at $0.16 and resisted at $0.18395.
Fibonacci analysis suggests several potential price targets. A sustained bullish trend could propel DOGE towards $0.65958 (1.0 Fib).
A breakout above $0.18395 could drive the price towards $0.30–$0.50. Conversely, a failure to hold support at $0.16 could lead to a decline towards $0.06167.
DOGE is currently trading at $0.1608, a crucial technical level. The market's reaction to this level will determine near-term direction.
Trend Analysis and Price Action
DOGE's price action remains within a long-term ascending channel. A recent bounce off the channel's lower boundary, supported at $0.16, has sparked discussion. Analyst Ali (@ali_charts) suggests that holding this support could trigger a rally to $0.57, while a breakdown could result in a drop to $0.06. 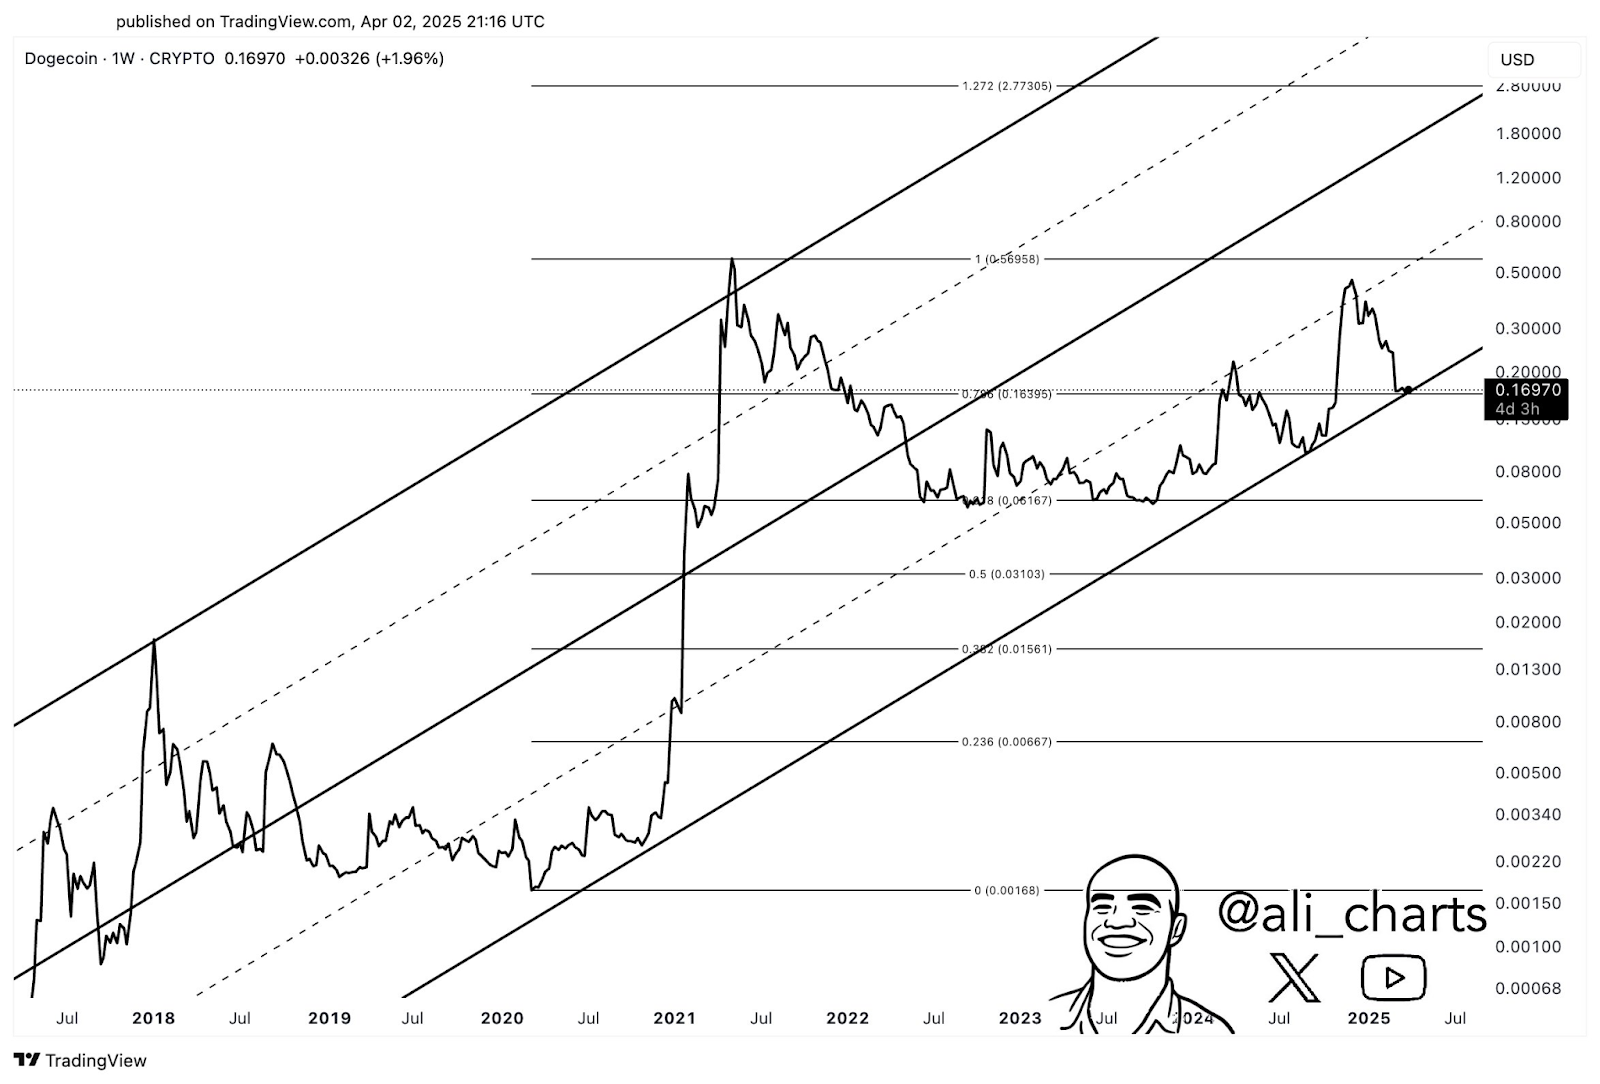
Source: Ali Charts
The ascending channel is a key factor in DOGE's daily price fluctuations. Historical price corrections have respected this long-term support. Immediate resistance sits at $0.18395 (Fib 0.786 level), a critical breakout point for traders.
Fibonacci Levels and Technical Insights
Fibonacci levels provide significant reference points for trading decisions. The $0.18395 resistance level is crucial; a breakthrough could propel DOGE towards $0.30–$0.50. Under a strongly bullish scenario, historical levels, including the 1.0 Fib at $0.65958, could be reached. A more aggressive bullish scenario could even lead to a speculative target near $2.77. However, failure to hold key support levels could trigger further price corrections. Technical analysts and traders closely monitor these levels to gauge future price movement.
Market Sentiment and Trading Outlook
Market sentiment is currently mixed, with traders weighing both bullish and bearish possibilities. Maintaining support above the trendline is crucial for a bullish outlook, potentially increasing market interest and trading volume.
Conversely, a fall below the trendline could intensify downward pressure, potentially retesting lower Fibonacci levels near $0.06167 or $0.03103. Careful analysis of technical patterns and Fibonacci levels remains vital for informed trading strategies.
 Coinpaper
 Finance Feeds
 CryptoNewsLand
 Deythere
 36Crypto
 TurkishNY Radio
 Bitcoin Sistemi
 CoinoMedia
 Yellow News


