

Dogecoin (DOGE) has surged back into the spotlight, fueled by renewed investor interest and increased market activity, sparking speculation of a significant price breakout. The cryptocurrency has seen impressive gains over the past week, with projections of a 600% rally circulating widely within the crypto community. Current market data, trading patterns, and technical analysis indicate DOGE is approaching a crucial juncture in its price structure.
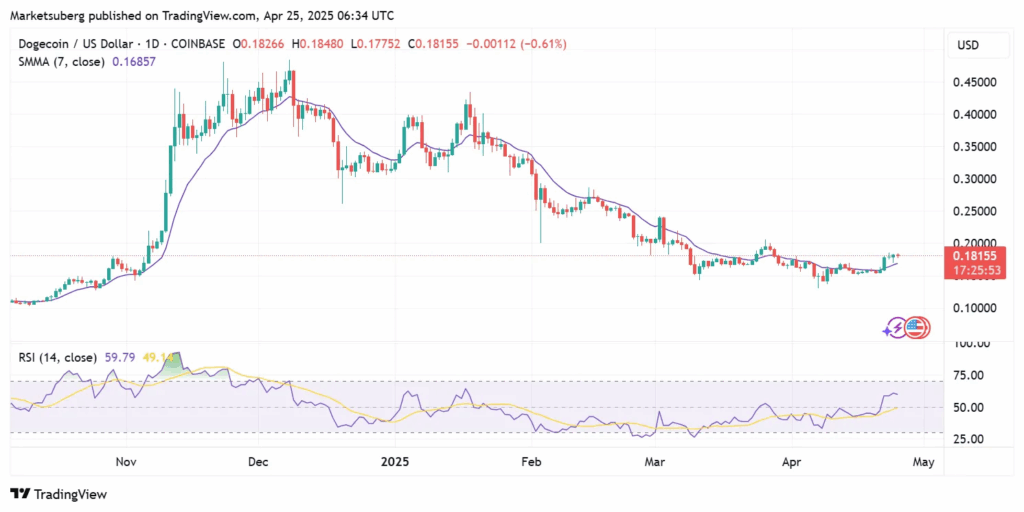
DOGE has demonstrated consistent upward momentum, climbing over 13% in the past week and reaching a daily high of $0.1813. While the price has experienced a slight pullback recently, it remains above its 9-day simple moving average (SMA), currently at $0.16429. Although short-term movement appears slightly bearish, sustained strong volume could maintain bullish momentum.
DOGE is currently trading within a robust support zone between $0.137 and $0.175, a range that historically served as an accumulation area. A decisive breakout above this range could trigger a substantial bullish rally. Increased secondary trading volume further suggests strong support, potentially mitigating any significant price decline.
Chart Patterns and Historical Parallels: A 600% Rally?
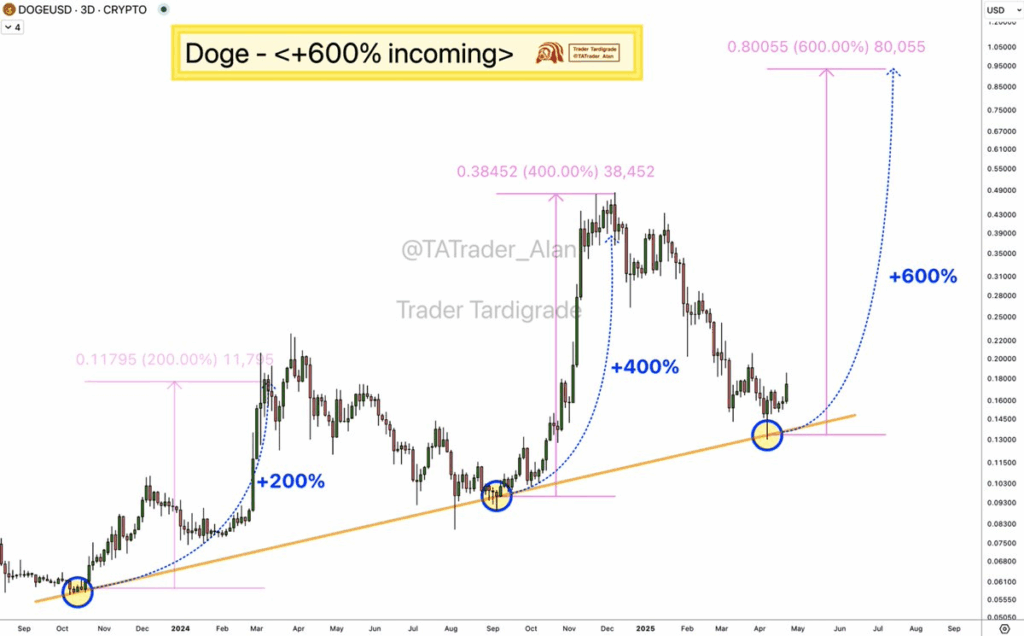
Several market analysts have conducted chart analyses revealing bullish patterns in recent months. Trader Tardigrade, for example, has identified a recurring trend where Dogecoin rebounds from an ascending support line, followed by substantial percentage rallies. Previous surges included a 200% rally in late 2023 and a nearly 400% increase in late 2024. Given the similarity in structure, a 600% move to a target price of $0.93 is considered possible.
Other analysts, such as Ali Martinez, have offered additional insights. Martinez notes that DOGE continues to adhere to a long-term logarithmic growth channel. This pattern has consistently influenced price movements during rally phases, particularly transitions from the midline to the upper boundary. If this pattern holds, it suggests a technical basis for further price increases toward higher resistance levels.
Stochastic RSI and Momentum Indicators
Technical indicators point to strong momentum. The Stochastic RSI reading is firmly in overbought territory, with the blue line at 100.00 and the orange signal line at 93.42. These high readings reflect aggressive buying pressure, though they also warrant caution regarding potential short-term corrections or consolidation.
While overbought conditions can sometimes precede a pullback, within the context of a potential breakout, strong RSI levels could confirm continued upward movement if volume remains high. Historical DOGE chart data reveals that during previous rallies, the RSI remained elevated for extended periods as the price advanced.
Market Sentiment and Future Outlook
Broader market sentiment surrounding Dogecoin has intensified following the recent price action and speculation of a 600% surge. Over the past 24 hours, trading volume reached $1.53 billion, and DOGE currently boasts a market capitalization of $27.01 billion with a circulating supply of 150 billion tokens. This trading activity underpins the recent price gains and demonstrates strong investor interest.
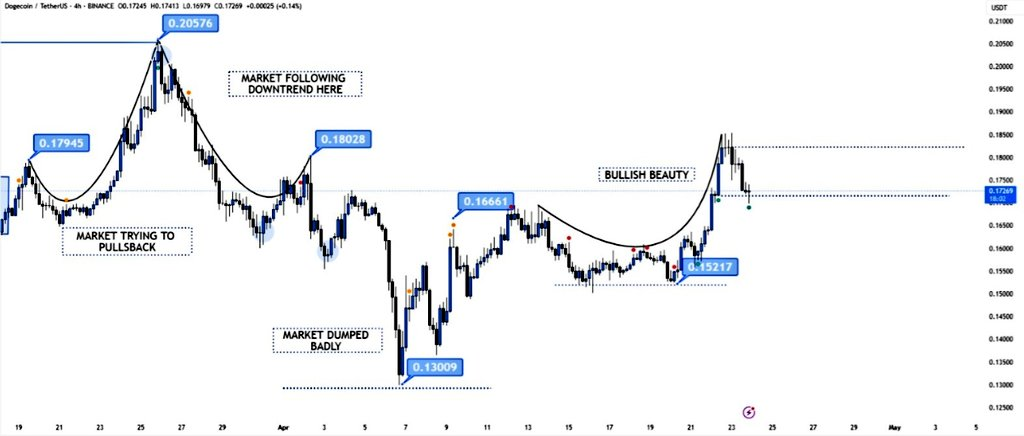
Market analyst BitGuru observes that Dogecoin has completed a classic cup-shaped recovery pattern and stabilized above key support levels. A breakout from the current level of approximately $0.1810 is considered possible, with the next potential target at $0.1850 or higher.
If DOGE maintains its position above the crucial support zone and continues attracting buying pressure, the path toward the $0.93 target becomes increasingly likely.
 Coinpaper
 Finance Feeds
 CryptoNewsLand
 Deythere
 36Crypto
 TurkishNY Radio
 Bitcoin Sistemi
 CoinoMedia
 Yellow News


