

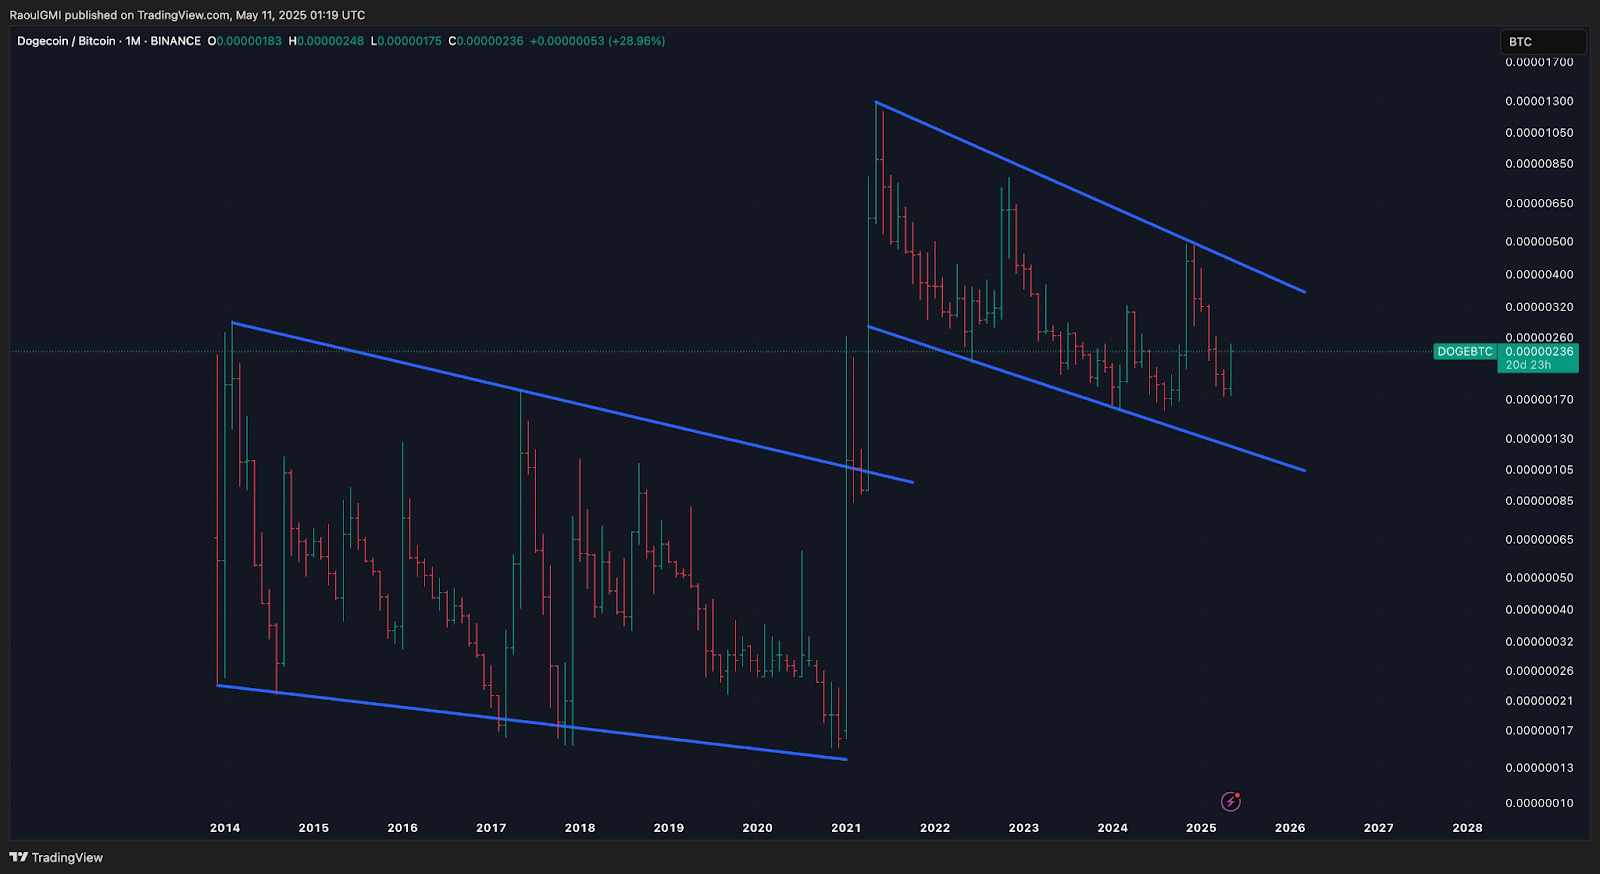
Dogecoin (DOGE) is experiencing renewed interest as technical analysis suggests a potential breakout against Bitcoin (BTC). Raoul Pal highlighted a bullish flag pattern forming on the long-term DOGE/BTC chart, indicating a possible upward movement after a period of consolidation. DOGE is currently trading at 0.00000236 BTC, representing a significant 28.96% increase recently. While still within a long-term downtrend, this surge could signal a trend reversal. The chart's extensive timeframe, spanning nearly 15 years, provides valuable insights into DOGE's long-term behavior.
Long-Term Patterns Suggest Potential for Significant Growth
The DOGE/BTC pair has historically followed two distinct downward channels. The first, from 2014 to 2020, showed consistent depreciation. However, a dramatic shift occurred from 2020 to 2021, with DOGE surging to a high of 0.00001300 BTC, signifying a major change in market sentiment.
Source: Raoul Pal
Since then, DOGE has followed a second downward channel (2021-early 2025). Despite continued price pressure, this channel's parallel nature to the first suggests a cyclical pattern. Several rallies occurred in 2021, 2022, and early 2024, but all failed to break the upper channel boundary.
Current Position Echoes Pre-Breakout Phase
Currently, DOGE trades in the lower half of the current channel, mirroring its position before the 2020 breakout. The price remains comfortably above the channel's low, indicating underlying strength. The recent price increase reinforces bullish momentum. A logarithmic chart clearly visualizes the percentage price movements.
The current price structure appears poised for a significant shift. A breakout from the channel could lead to a historical repeat, with the next few months crucial in determining the direction. Sustained upward momentum could propel DOGE to new highs.
 Coinpaper
 Finance Feeds
 CryptoNewsLand
 Deythere
 36Crypto
 TurkishNY Radio
 Bitcoin Sistemi
 CoinoMedia
 Yellow News


