

Dogecoin's weekly chart shows a TD Sequential "9" buy signal, suggesting easing selling pressure and potential price recovery. Significant support exists around $0.165, with traders awaiting a break above moving averages to confirm upward momentum. Holding above this support could propel Dogecoin towards $0.20–$0.24; a breakdown could lead to a decline towards $0.13–$0.14.
A recent technical analysis highlights a possible Dogecoin trend reversal. The weekly chart's TD Sequential "9" buy signal often precedes relief rallies, appearing after weeks of bearish price action. This signal marks a potential easing of selling pressure.
Technical Signal Overview
The analysis reveals a TD Sequential "9" buy signal on the weekly timeframe. This signal, frequently observed near downtrend exhaustion, suggests a potential market shift. Its presence on the weekly chart strengthens the possibility of a price rebound. The signal indicates a potential change in market direction, aiding traders in anticipating future price movements.
Support Levels and Moving Averages
A crucial ascending trendline connects multiple higher lows, acting as a key support level repeatedly respected by price action. This trendline reflects a significant underlying structure. 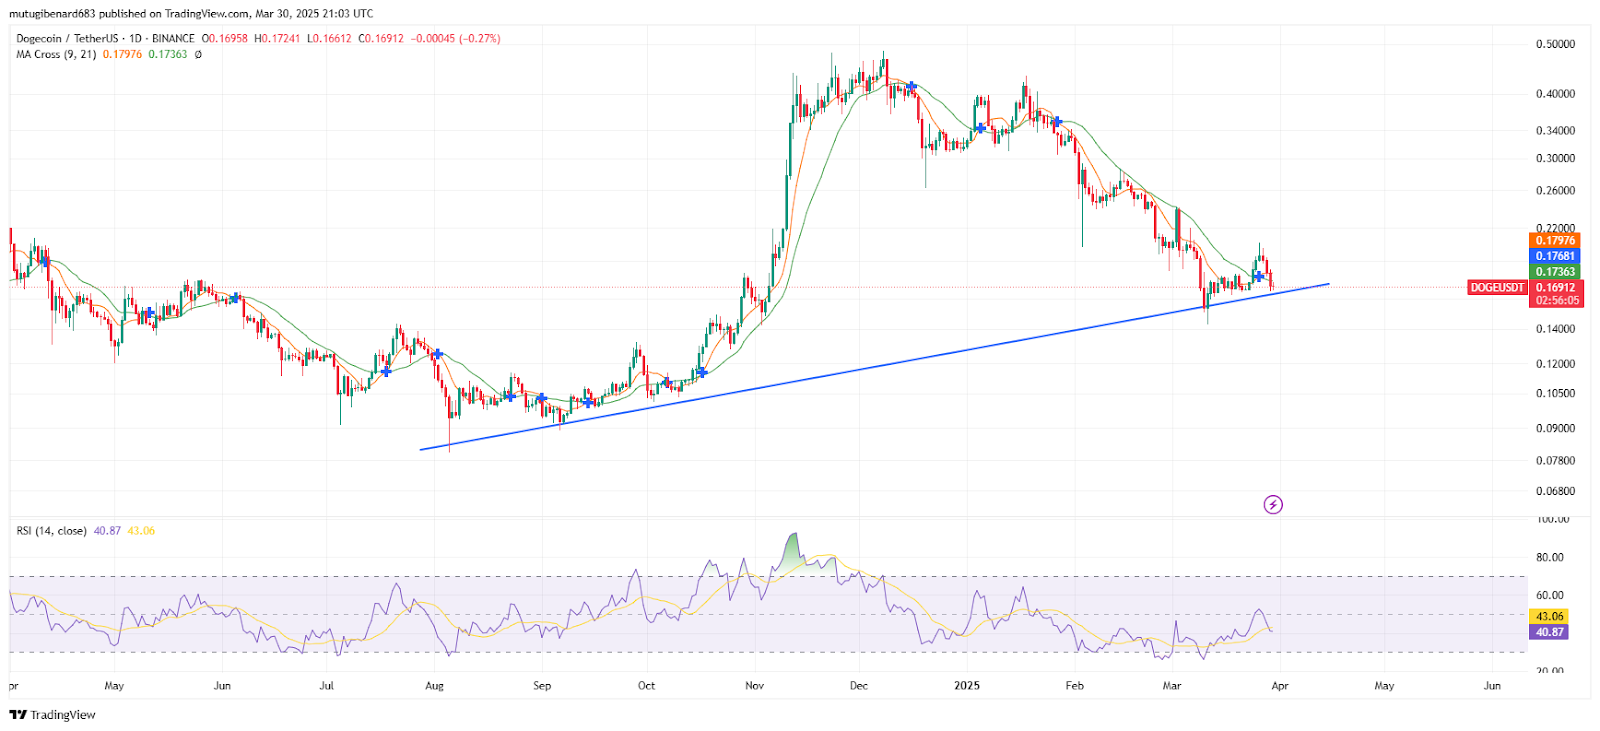
Source: TradingView
The analysis also incorporates a moving average crossover between the 9-period and 21-period lines. The current price trading below these averages indicates short-term bearish sentiment. A move above these averages could signal a shift in market dynamics.
This technical framework combines support and resistance levels. The trendline and moving averages together define key price regions, aiding in the identification of crucial market levels.
Market Sentiment and Future Projections
The RSI (14) near 40.95 suggests Dogecoin is approaching oversold conditions, potentially indicating returning buyers. A rising RSI could favor upward price movement.
Maintaining support around $0.165 could drive Dogecoin towards $0.20–$0.24. A weekly close above $0.24 might confirm positive momentum. Conversely, breaking the trendline support could trigger a decline to $0.13–$0.14.
This analysis provides a structured view of potential price scenarios. The convergence of the TD Sequential signal, trendline support, moving averages, and RSI readings offers a comprehensive outlook.
 Coinpaper
 Finance Feeds
 CryptoNewsLand
 Deythere
 36Crypto
 TurkishNY Radio
 Bitcoin Sistemi
 CoinoMedia
 Yellow News


