

Dogecoin's $0.50 zone is currently holding approximately $380M in short positions, potentially signaling a significant breakout opportunity. Furthermore, the DOGE/BTC support level and the existing Elliott Wave structure both lend credence to a bullish continuation.
Dogecoin (DOGE) is navigating a critical technical juncture that could dictate its forthcoming trajectory. Liquidation heatmap data indicates a substantial liquidity cluster around the $0.50 mark, estimated at over $380 million.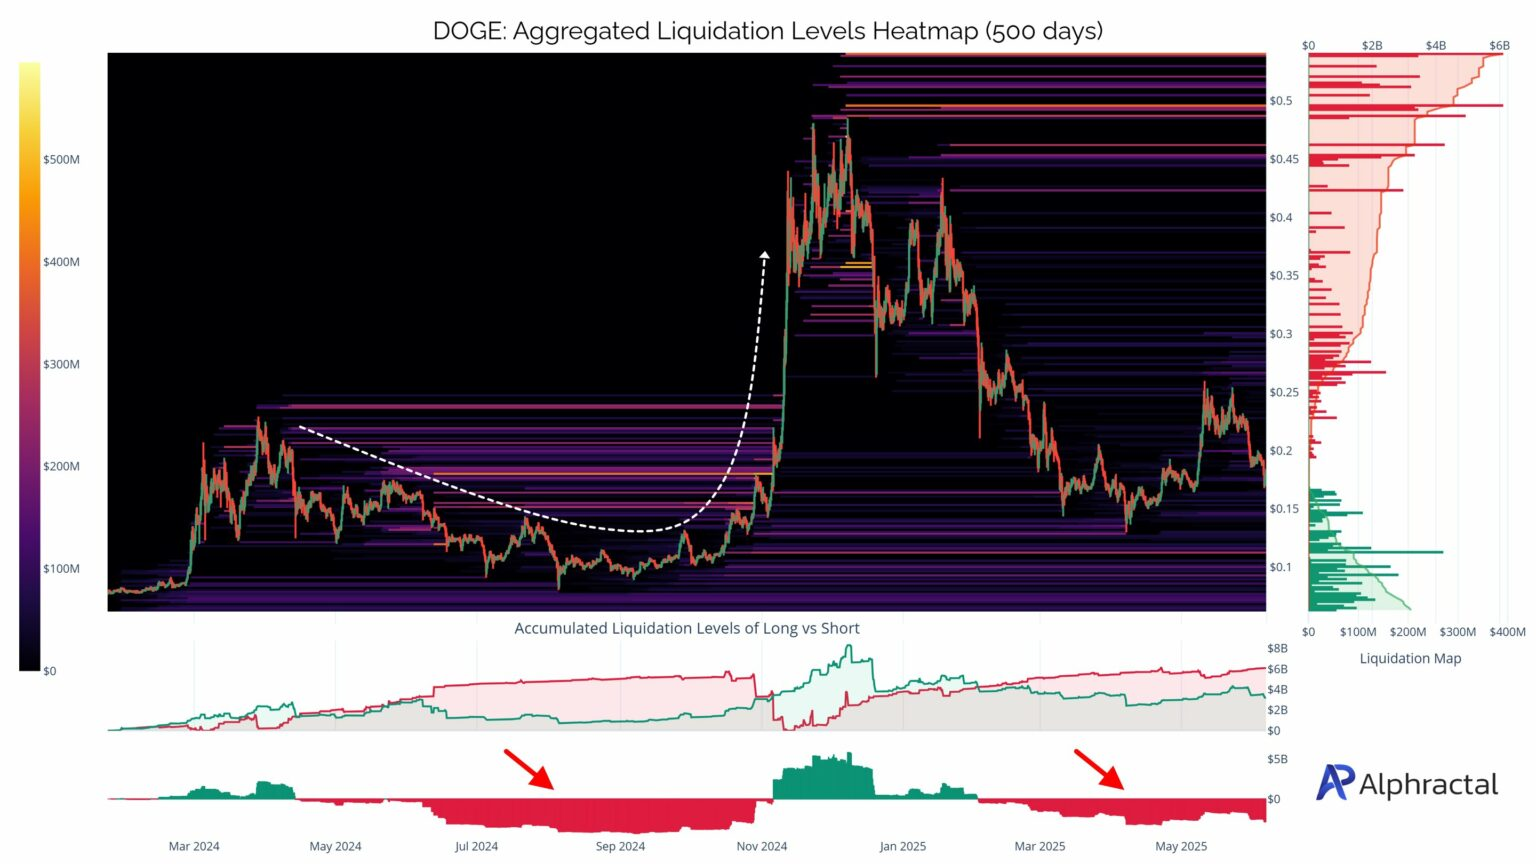
Source: Alphractal
This level, established during a prior DOGE rally, represents a notable concentration of short positions. Analysts suggest that if selling pressure diminishes, these short positions could act as fuel for a potential breakout. Historical data reveals instances where similar setups preceded substantial DOGE rallies.
Before its previous surge, DOGE underwent a period of consolidation near its lows before experiencing a sharp upward movement. The current chart pattern mirrors this previous formation, hinting at a possible reversal. A successful breakout through this liquidity barrier could trigger renewed bullish activity, particularly if momentum builds above the $0.50 threshold.
DOGE/BTC Ratio and Memecoin Sector Show Divergence
The DOGE/BTC ratio is approaching a crucial support zone, reminiscent of the pattern observed prior to the 2021 bull run. Accumulated liquidation levels remain heavily skewed toward short positions, increasing the likelihood of a price reversal.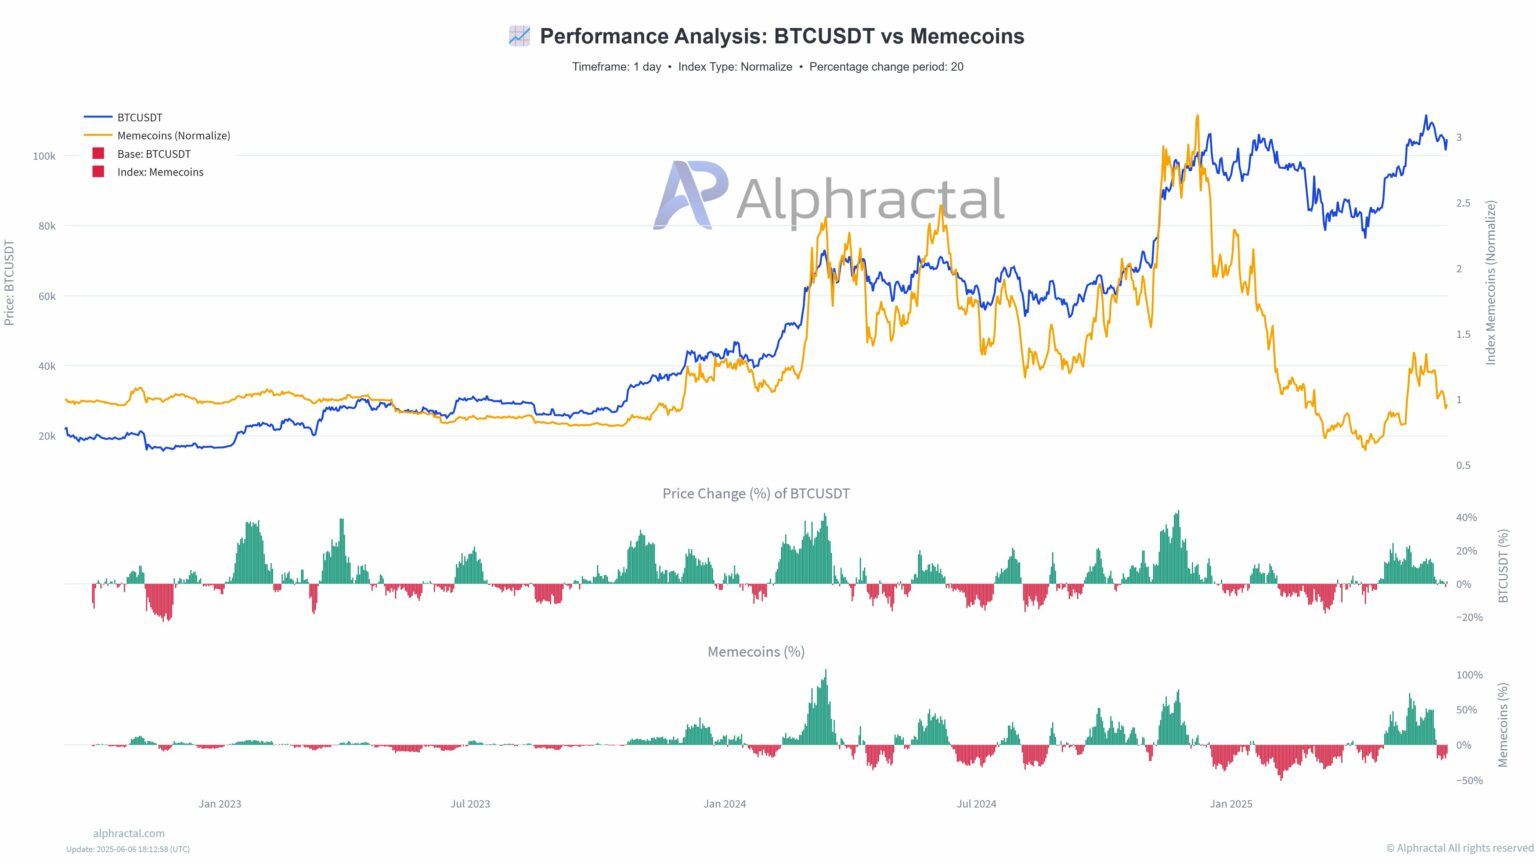
Source: Alphractal
The broader memecoin sector presents a mixed performance. While the memecoin index has rebounded, surpassing its 2021 market valuation, Open Interest remains relatively limited at $3.2 billion. Daily trading volume across memecoins currently stands at $12 billion, significantly lower than that of Bitcoin or Ethereum.
A comparative analysis reveals BTCUSDT outperforming the memecoin index, with the divergence widening since the beginning of the year.
Despite this relative underperformance, analysts suggest that memecoins could regain momentum if Bitcoin continues its upward trend. Historically, bull cycles in BTC often trigger speculative rallies in lower-capitalization assets such as DOGE.
Technical Structure Points to Potential Elliott Wave Rally
DOGE is maintaining a long-term support zone (highlighted in green), which has served as a consolidation area since 2021. The current price structure aligns with a potential Elliott Wave pattern. According to this analysis, DOGE may be nearing the completion of Wave 4, with Wave 5 potentially targeting higher price levels.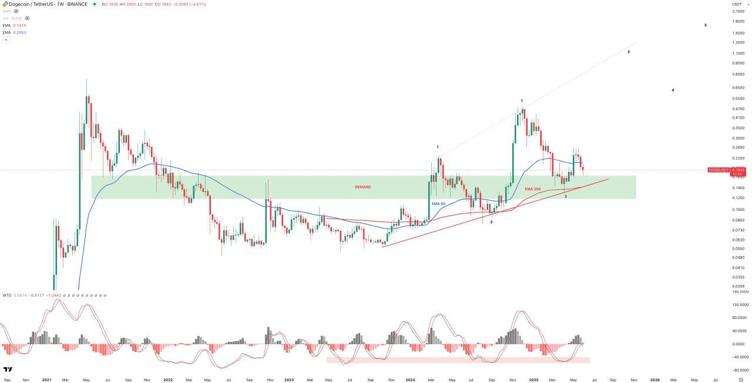
DOGE/USDT 1W Price Chart Source: TradingView
Supporting indicators include the alignment of the 50-week and 200-week moving averages below the current price. Momentum indicators, such as the MACD, suggest a potential return of bullish strength, although further confirmation is required. Since late 2022, DOGE has established higher lows, indicating gradual accumulation.
A robust rebound from the support region could validate this technical setup. Analysts indicate that as long as DOGE maintains its position above this zone, a continuation of the upward trend remains a distinct possibility. If confirmed, the next upward movement could challenge the $0.50 liquidity level and potentially initiate a broader trend reversal.
Dogecoin is currently positioned at a critical technical juncture, characterized by increasing short interest and converging support levels. While memecoins are lagging behind major crypto assets, DOGE's underlying structure and historical behavior suggest that a breakout scenario remains within the realm of possibility.
 Coinpaper
 Finance Feeds
 CryptoNewsLand
 Deythere
 36Crypto
 TurkishNY Radio
 Bitcoin Sistemi
 CoinoMedia
 Yellow News


