

Dogecoin's Historical Triangle Pattern Suggests Imminent Breakout
Dogecoin is exhibiting a recurring historical triangle pattern that has previously preceded significant price rallies, suggesting a high-probability breakout is imminent. Technical indicators and increasing trading volume near potential breakout zones align with past cycles, indicating a potential surge beyond $0.73.
Since 2014, similar triangle formations have consistently led to explosive Dogecoin rallies, strongly suggesting a similar upward move is likely. Currently trading near $0.12, the meme coin shows strong technical signs of a major upward trend. Key indicators highlight the formation of symmetrical and descending triangles, both historically followed by powerful breakouts. This pattern supports a bullish continuation, potentially driving gains between +200% and +330%, mirroring previous cycles. Market sentiment remains optimistic, fueled by repeating trends and consistent technical formations. The increase in volume around breakout zones further strengthens this bullish outlook. This recurring pattern, observed from 2014 to 2025, consistently resulted in significant vertical price momentum.
Repeated Patterns Signal a High-Probability Move
Dogecoin's chart displays a recurring pattern: descending triangles transitioning into symmetrical consolidations. These patterns have reliably preceded aggressive upward breakouts. For example, a breakout in 2017 followed a descending triangle, and a subsequent symmetrical triangle formed just before a price surge that marked Dogecoin's early 2018 all-time high.
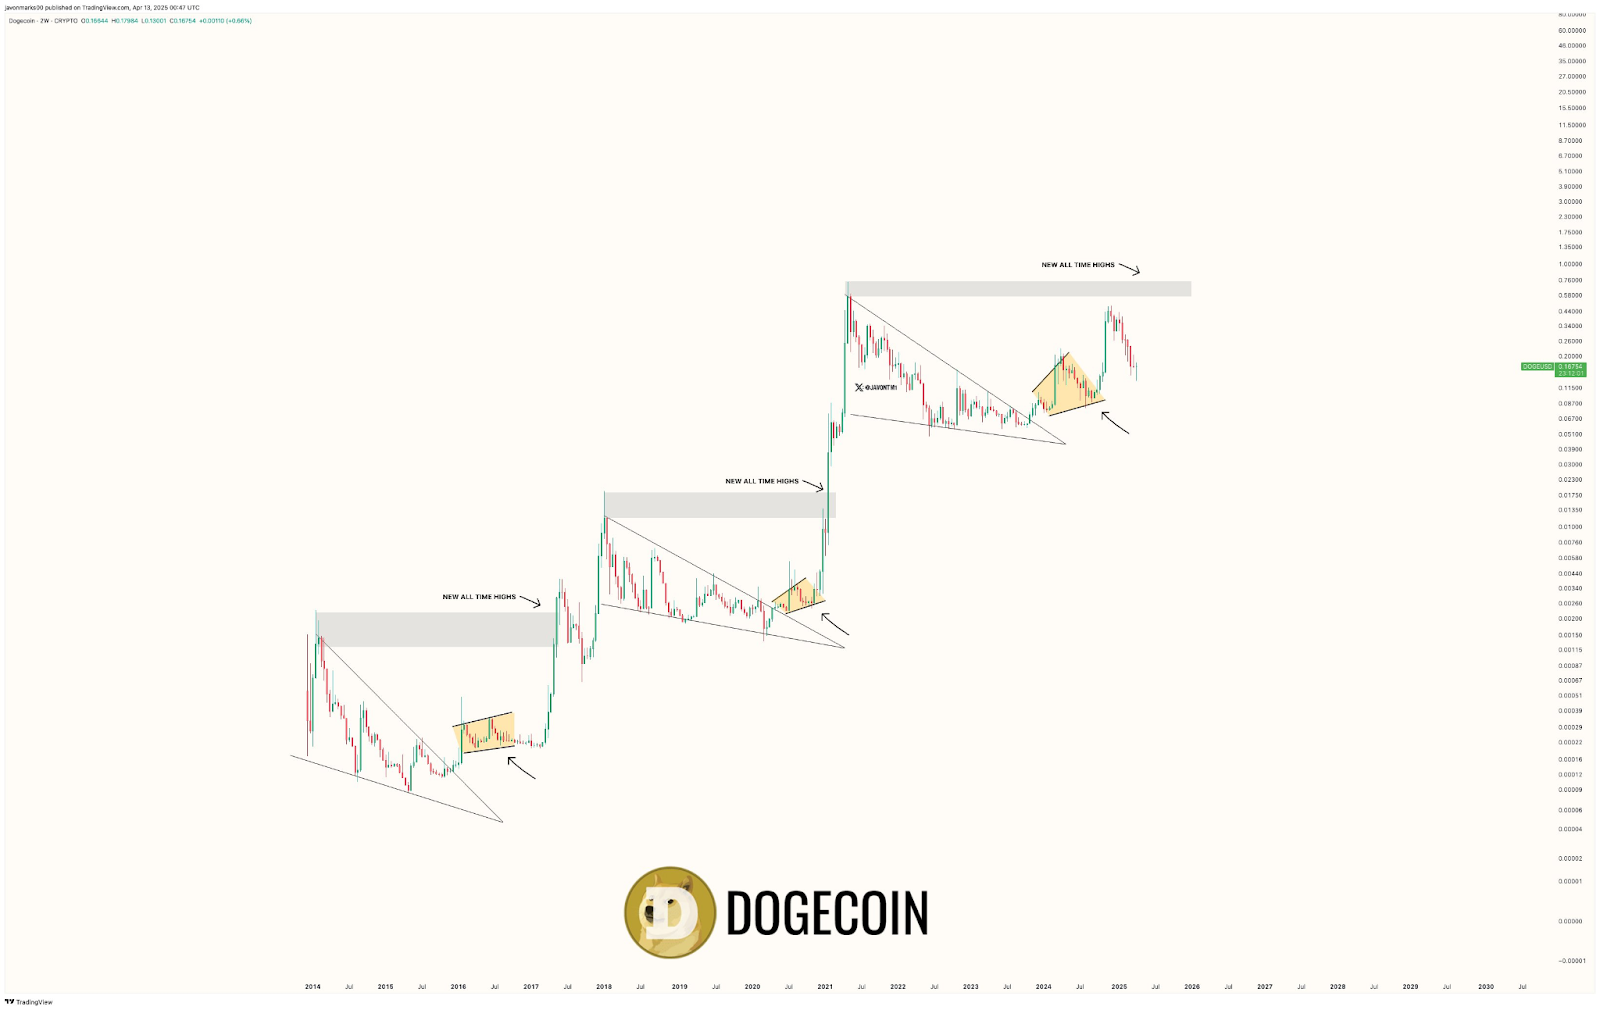
Source: Javon Marks
A similar setup occurred from 2018 to 2021. The price consolidated within a descending triangle, followed by a symmetrical triangle before a breakout, triggering the 2021 all-time high. Each triangle formation resulted in rapid upward price movements, significantly increasing value in short periods.
Current Setup Echoes Past Cycles
From 2022 to 2023, Dogecoin mirrored previous cycles, forming a descending triangle followed by a symmetrical triangle, resulting in a strong breakout into a new resistance zone. This pattern repeated in 2024 with another symmetrical triangle, leading to a moderate rally.
Currently, the price is above $0.12, rebounding from the most recent triangle breakout. Each bullish phase began with range compression and concluded with aggressive rallies. The historical consistency in Dogecoin's price action is evident, with each structural formation preceding major breakouts. Therefore, the current setup strongly suggests another substantial price increase is likely.
 Coinpaper
 Finance Feeds
 CryptoNewsLand
 Deythere
 36Crypto
 TurkishNY Radio
 Bitcoin Sistemi
 CoinoMedia
 Yellow News


