

Dogecoin (DOGE) Price Analysis: Bullish Signals and Potential for Significant Growth
Dogecoin has shown a strong recovery, rebounding from $0.15217 and forming a bullish cup pattern. The price increased from $0.13009 to $0.179, indicating a significant recovery phase. A long-term trendline analysis suggests a potential 600% breakout, targeting $0.80055.
Dogecoin is currently stabilizing above key support levels, suggesting renewed bullish momentum across various timeframes. Analysts have observed recurring technical patterns that could support a substantial price increase.
Short-Term Analysis: A Bullish Cup and Handle
Technical analyst BitGuru highlights a rounded bottom formation on the 4-hour chart, preceding DOGE's rise from $0.15217 to a high near $0.179. This pattern, along with other technical indicators, suggests early recovery structures. 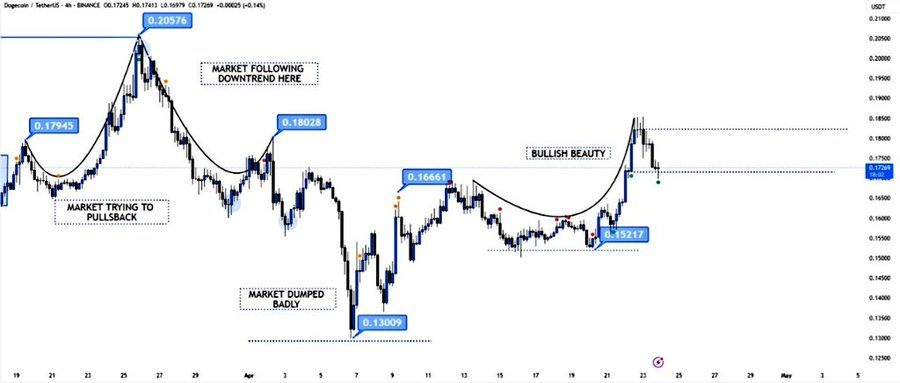
Source: BitGuru
BitGuru's analysis shows Dogecoin developing strong short-term momentum and cyclical price behavior. Buyers are consistently reacting to support and resistance levels, establishing a base for potential upward continuation. Analysts are closely monitoring these levels for confirmation of sustained upward movement or a potential breakdown.
BitGuru describes DOGE's recent price action as a "bullish cup" recovery, starting at $0.15217 after a dip from $0.20576. The analysis shows clear market cycles, including an initial pullback attempt near $0.17945, a subsequent surge to $0.20576, and then a confirmed downtrend breaking through support zones. A sharp selloff dropped DOGE to $0.13009, its lowest point, before a gradual climb to $0.16661, followed by a retracement to $0.15217. The current uptrend is described as having a strong technical structure supporting continued growth. The price currently holds above $0.17394, with the next resistance level near $0.1850. A sustained hold above this level could lead to a breakout beyond recent highs. BitGuru's analysis focuses on short-term support and resistance levels.
Long-Term Analysis: Significant Upside Potential
Trader Tardigrade's 3-day and long-term trend analysis reveals a broader technical structure with repeating rallies from an ascending trendline dating back to late 2023. 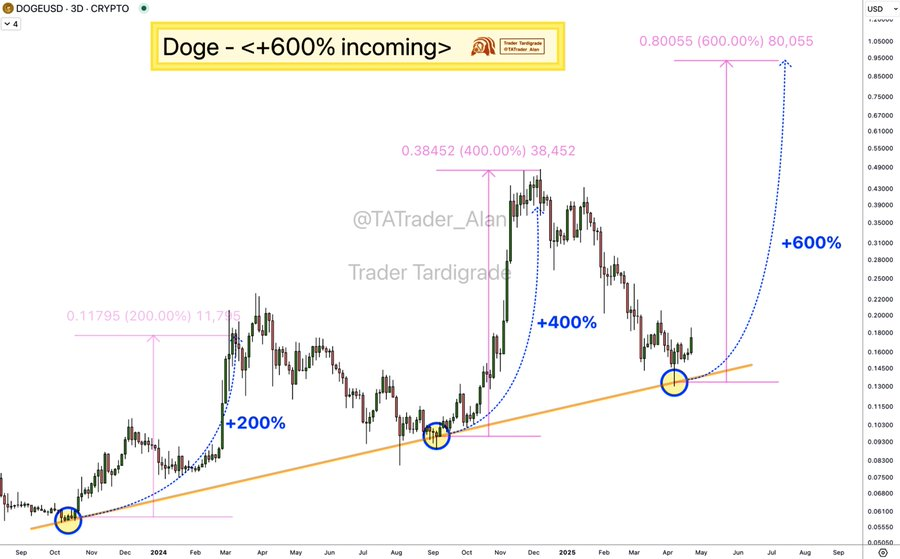
Source: Trader Tardigrade
Tardigrade's analysis shows three key support bounces resulting in gains of 200%, 400%, and a projected 600%. Each rally started near the trendline, following higher lows and maintaining structural consistency. These rallies include moves from $0.04 to $0.11795, and from $0.06 to $0.38452. The latest bounce near $0.115 projects a move towards $0.80055. Tardigrade emphasizes the trendline's reliability, highlighting the timing and magnitude of each bounce. This projection follows a steep parabolic arc, without using indicators like RSI or volume, and is based solely on price history and technical structures.
 Coinpaper
 Finance Feeds
 CryptoNewsLand
 Deythere
 36Crypto
 TurkishNY Radio
 Bitcoin Sistemi
 CoinoMedia
 Yellow News


