

Dogecoin garnered significant market attention earlier today following a substantial transfer of 200 million DOGE, valued at over $35 million, to the OKX exchange.
This movement originated from a single, currently unidentified wallet, prompting speculation about a potential sell-off by a major holder.
This development, in conjunction with existing price patterns and market metrics, is focusing attention on a crucial support level at $0.168. A break below this level could precipitate a significant price decline of up to 30%.
Large DOGE Movement Sparks Selloff Concerns
The transfer of 200 million DOGE, valued at approximately $35.9 million, from an unknown wallet to the OKX exchange has raised concerns within the market. Large-scale movements like this are often interpreted as potential sell-offs by significant holders. This sudden increase in supply could exert downward pressure on DOGE if buying demand fails to match the influx.
This activity aligns with a notable increase in the Age Consumed metric, indicating that older DOGE tokens are being moved after a prolonged period of inactivity. Historically, such activity has been associated with profit-taking by long-term holders, particularly in anticipation of market corrections. This has led many traders to anticipate heightened volatility.

At the time of writing, the DOGE/USD price is $0.1760, trading just above the critical support level of $0.168. A close below this level could initiate a breakdown from the symmetrical triangle pattern.
Technical Chart Shows Critical Symmetrical Triangle
Dogecoin (DOGE/USD) is exhibiting a symmetrical triangle pattern on the daily chart, with price action compressing between lower highs and higher lows.
DOGE is currently trading around $0.175, positioned just above key support at the 0.786 Fibonacci level ($0.1769).
According to Ali's chart on X, Dogecoin must maintain a position above $0.168 to avert a potential 30% price drop. A breakdown below this support level could pave the way toward $0.1284 and even lower Fibonacci extension levels.
Should DOGE fail to hold above $0.168, the subsequent support levels are identified at $0.155 and $0.1284, followed by Fibonacci extensions at $0.0934 and $0.0787. This scenario would confirm a bearish breakdown, particularly if accompanied by increased trading volume.
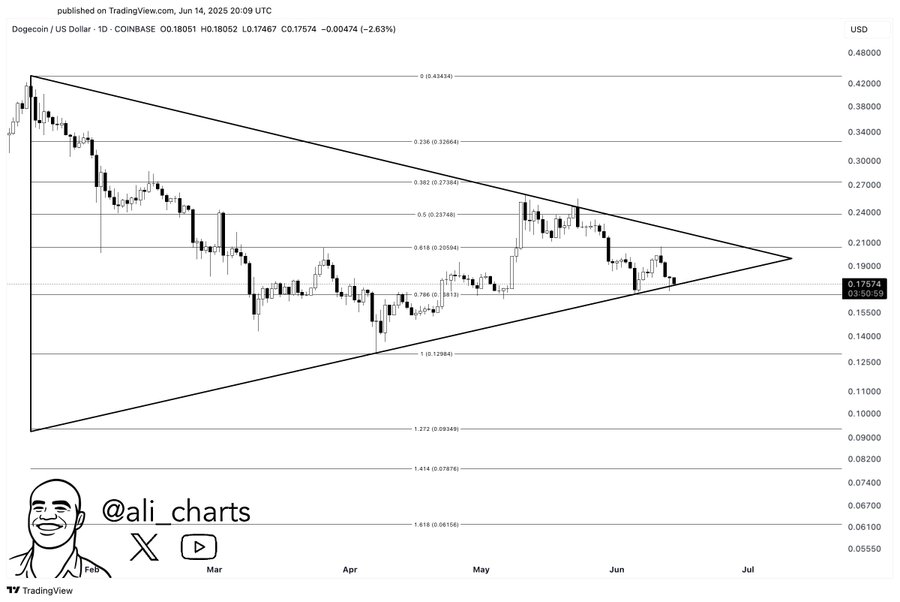
Conversely, a rebound from current levels could maintain the price within the triangle pattern. A breakout above $0.2056 may trigger a rally toward $0.2386 and $0.2739.
Traders are closely monitoring DOGE, anticipating a decisive move near the triangle's apex.
Dogecoin Price Trading Volume and Derivatives Show Mixed Signals
Spot market activity reveals reduced volume, with the 24-hour trading volume for DOGE decreasing by more than 44% to approximately $1.92 billion.
This suggests diminished active interest and reinforces the current consolidation trend, which often precedes a breakout.
In the derivatives market, open interest has also slightly decreased by 0.74%, reflecting cautious behavior among futures traders.
However, the options market has experienced increased activity. Options volume has risen by over 91%, and open interest has climbed nearly 2%, indicating that traders are preparing for a significant price movement in either direction.
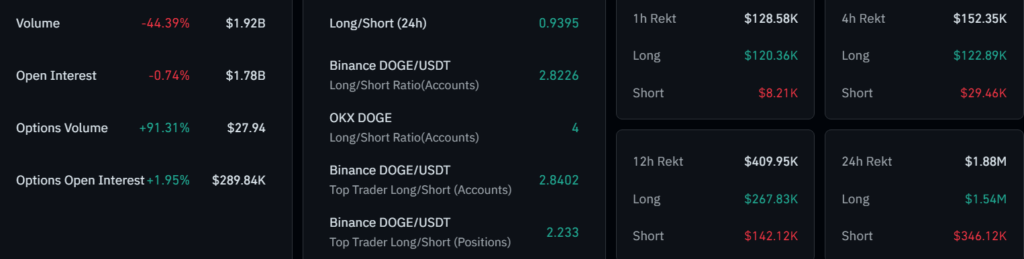
Concurrently, long/short data reveals mixed sentiment. The global long/short ratio stands at 0.9395, indicating a slight inclination toward short positions.
However, top traders on Binance and OKX exhibit a stronger long bias. This divergence may suggest that retail traders are more bearish, while larger accounts remain optimistic about the price holding above $0.168.
DOGE Holders Monitor $0.168 As Key Level
At the time of writing, Dogecoin (DOGE/USD) was trading at $0.1760, which is lower than the 20-period SMA of $0.17899, indicating bearish pressure in the short term.
The price is ranging between $0.1685 and $0.1894, indicating low volatility and the consolidation of prices.
This aligns with the overall symmetrical triangle observed on the daily chart, strengthening the possibility of a breakout or breakdown.
The Bollinger Bands are converging, implying volatility is being squeezed. The lower band currently constitutes the critical support that DOGE is close to, at a price of 0.1685.
Any further loss could drag the price to somewhere between $0.155 and $0.145.
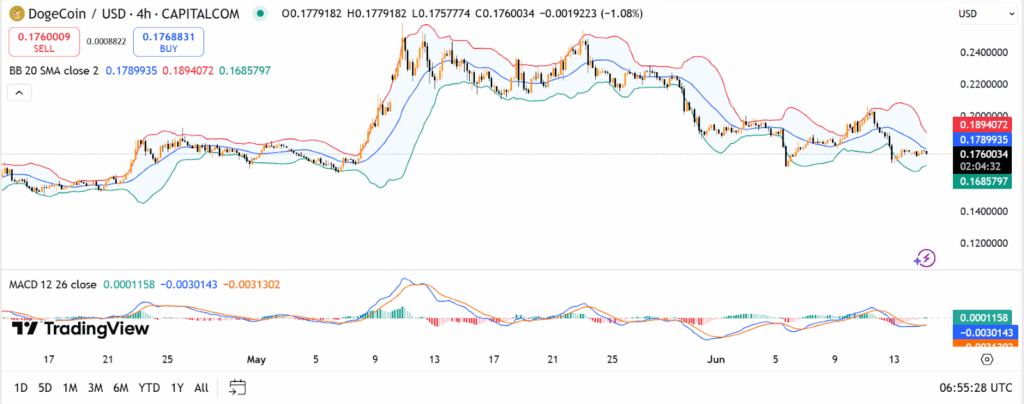
However, should the support hold, a movement to the midline and upper band with targets of $0.179 and $0.1894, respectively, is possible.
Currently, the MACD is in a position of an early bullish crossover but still below the zero line, which is a sign of poor momentum.
Any rally projection must be accompanied by a corresponding volume increase. If DOGE breaks the resistance of 0.189, an upside to 0.200-0.215 can be considered.
 AD HOC NEWS
 AD HOC NEWS
 Coinpaper
 Coinpaper
 Finance Feeds
 CryptoNewsLand
 Deythere
 36Crypto
 TurkishNY Radio


