

Dogecoin is exhibiting compelling indicators of a structural market shift after enduring months of bearish conditions. A robust breakout, followed by bullish confirmations, suggests a potential for further upward movement, contingent on the maintenance of key support levels. Momentum indicators are aligning favorably, the technical structure is evolving, and buyers are progressively regaining control.
Despite recent volatility affecting the broader cryptocurrency market, Dogecoin (DOGE) has been quietly establishing the foundation for a significant trend reversal. Having broken free from a prolonged bearish trend, DOGE experienced a surge towards high-timeframe resistance at $0.23 before encountering rejection. Critically, this pullback did not result in a complete breakdown; instead, it rotated into a crucial support area, which appears to be holding steady. This price behavior, corroborated by volume dynamics and key indicators, suggests underlying strength rather than inherent weakness.
Key Technical Points:
- Major Market Structure Break: DOGE has decisively broken out of a protracted bearish structure, initiating a trend shift characterized by an impulsive rally to $0.23.
- Critical Support at $0.16: Price is currently rotating into a high-timeframe support zone reinforced by the 0.618 Fibonacci retracement level and the Point of Control.
- 200-Day Moving Average Retest: A bullish candle close above the 200 MA, followed by a successful retest, validates the strength of the current upward move.
- Stochastic RSI in Oversold Region: Currently at 19, this level has historically proven reactive. A bullish crossover and subsequent move above 20 often precede momentum shifts.
- Bullish Continuation Signal: Constructive price action within the support cluster would create an ideal long entry scenario, targeting a move toward the previous high at $0.23 and potentially beyond.
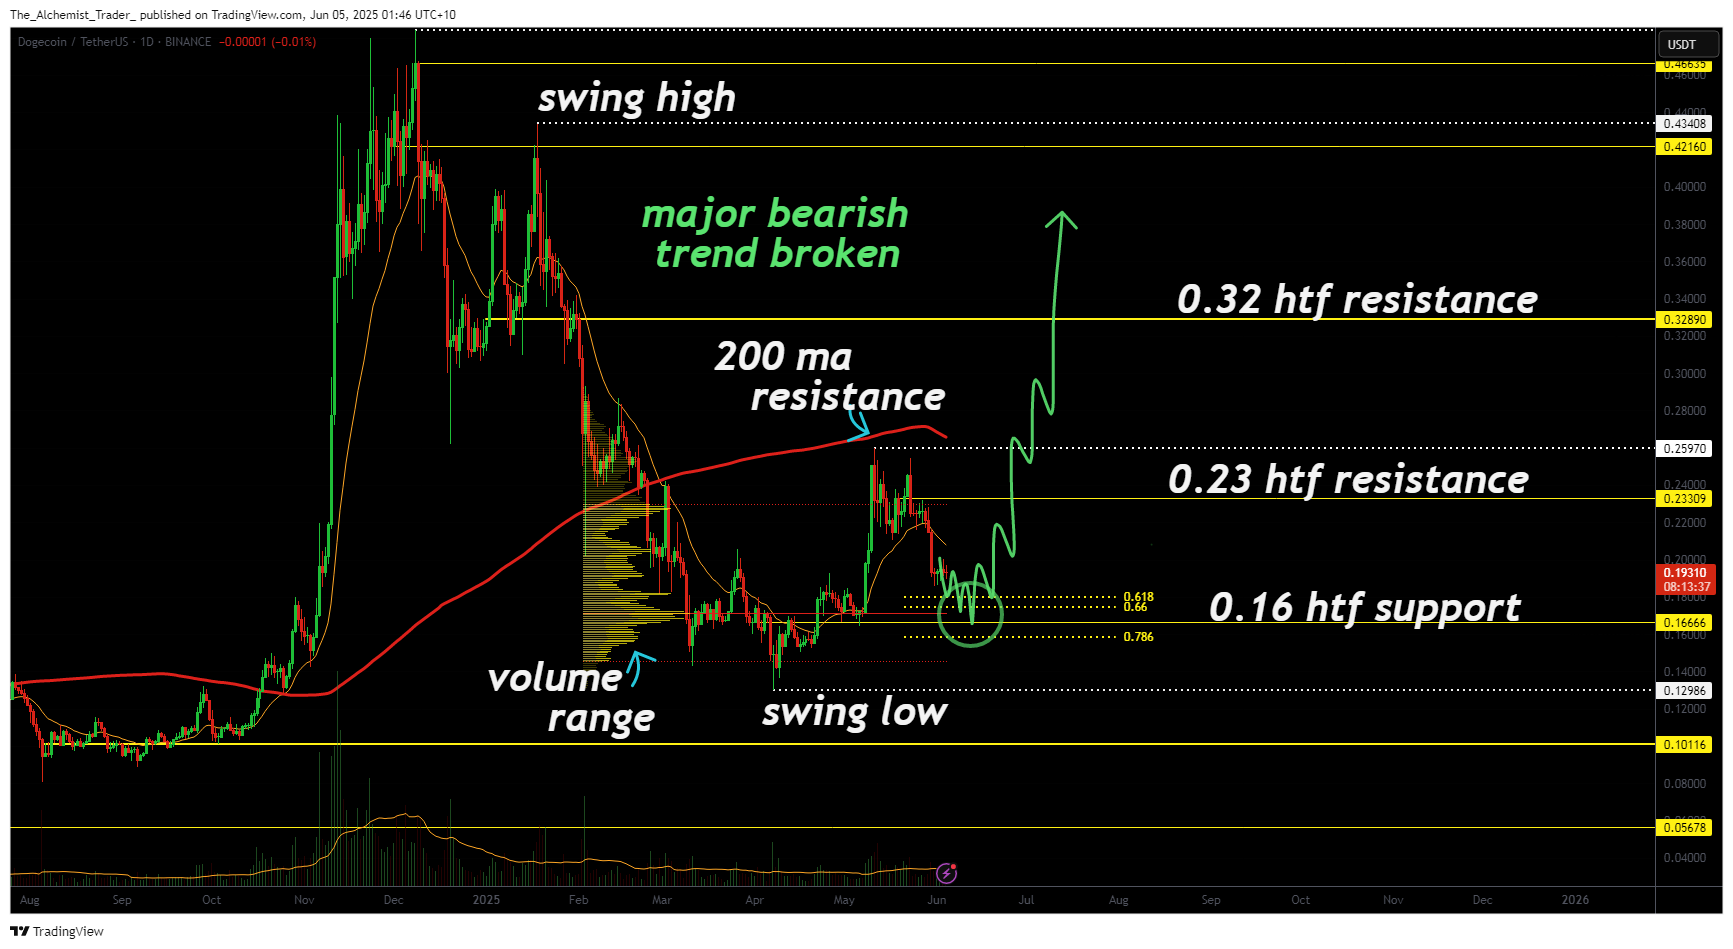
DOGEUSDT (1D) Chart, Source: TradingView
The breakout from Dogecoin's established bearish structure represents more than just a short-term anomaly; it carries deeper implications. The impulsive breakout candle surged towards the $0.23 resistance level, a zone that has historically served as a pivotal point for DOGE's macro behavior. The recent rejection from this area appears to be a healthy correction, rather than a failure of the emerging trend.
More importantly, this move signifies a clear shift in market structure: higher highs, a confirmed retest of the 200-day MA, and a developing bullish Stochastic RSI setup all indicate the potential for continued upward momentum. DOGE is currently consolidating within a cluster of support zones, and if these levels hold firm, a new upward leg could retest prior swing highs and possibly initiate a broader uptrend.
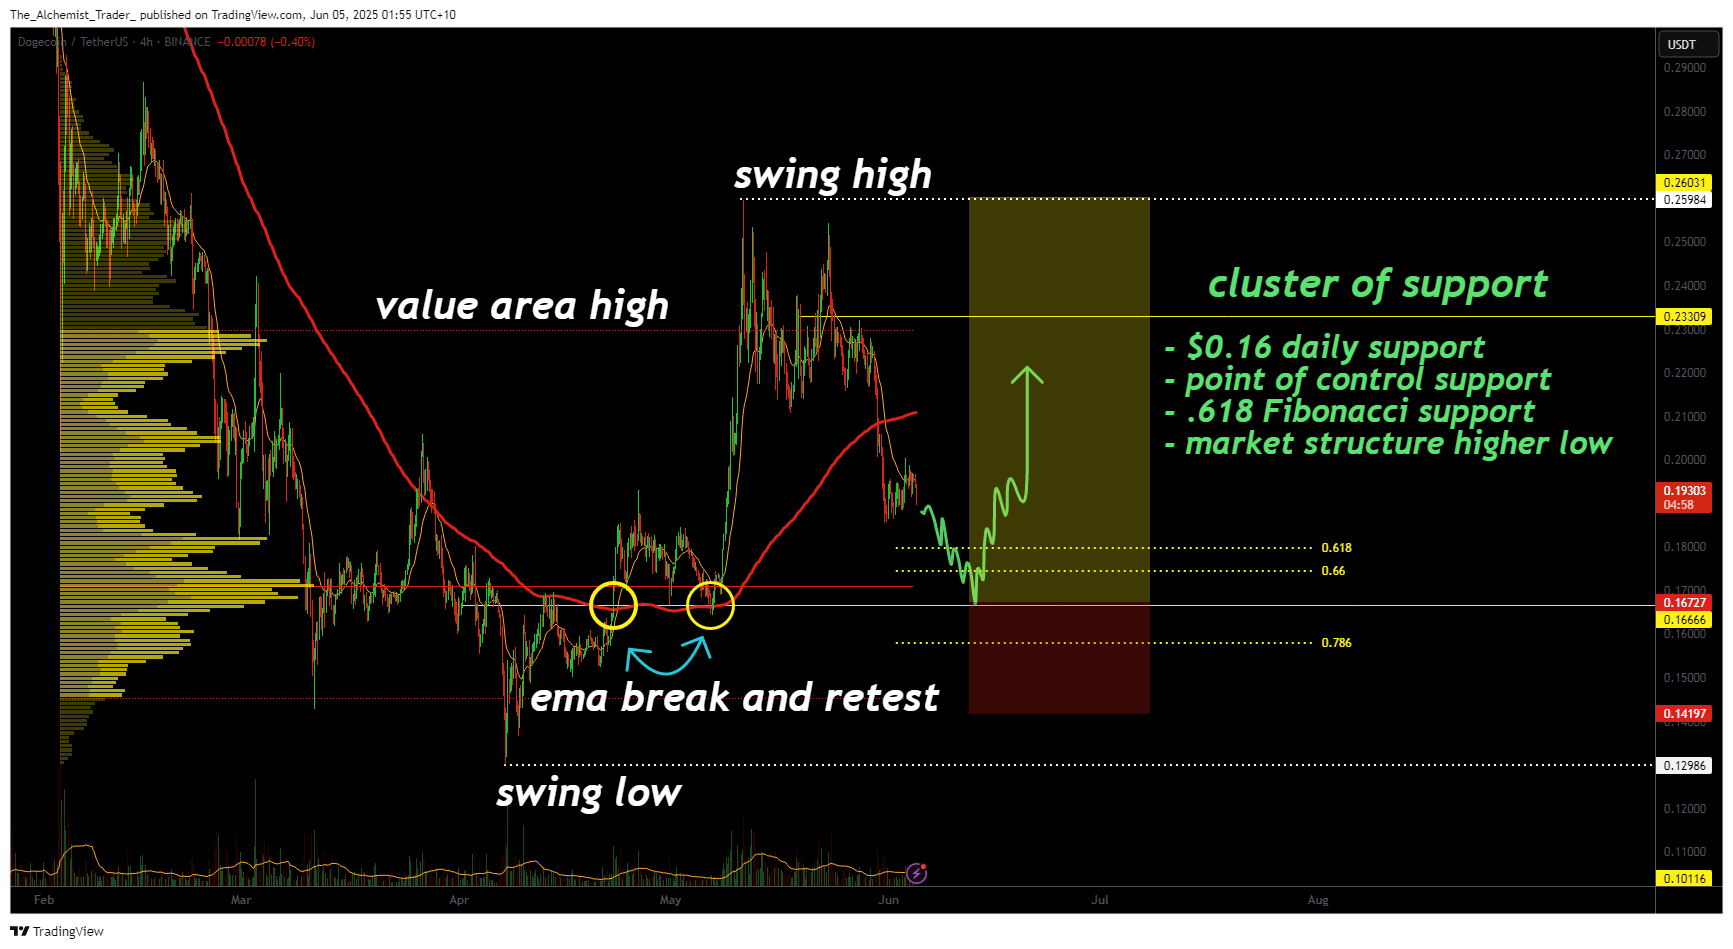
DOGEUSDT (4H) Chart, Source: TradingView
The most significant aspect of the current price action is the retest zone around $0.16. This level carries considerable weight due to the confluence of several technical factors: the 0.618 Fibonacci retracement, the Point of Control derived from volume profile data, and a dynamic higher low region within the overall market structure. From a trader's perspective, the alignment of these technical indicators creates a high-probability zone for a bullish reversal or continuation.
Adding further support to the bullish thesis is the behavior observed around the 200-day moving average. Dogecoin recently printed a full candle close above the 200 MA, a feat that has not occurred with such conviction in recent months. This was followed by a textbook bullish retest, where the price retraced, tested the moving average, and immediately rebounded, establishing a new swing high above the value area. This constitutes a strong signal of accumulation beneath resistance and suggests that buyers are gradually overpowering distribution.
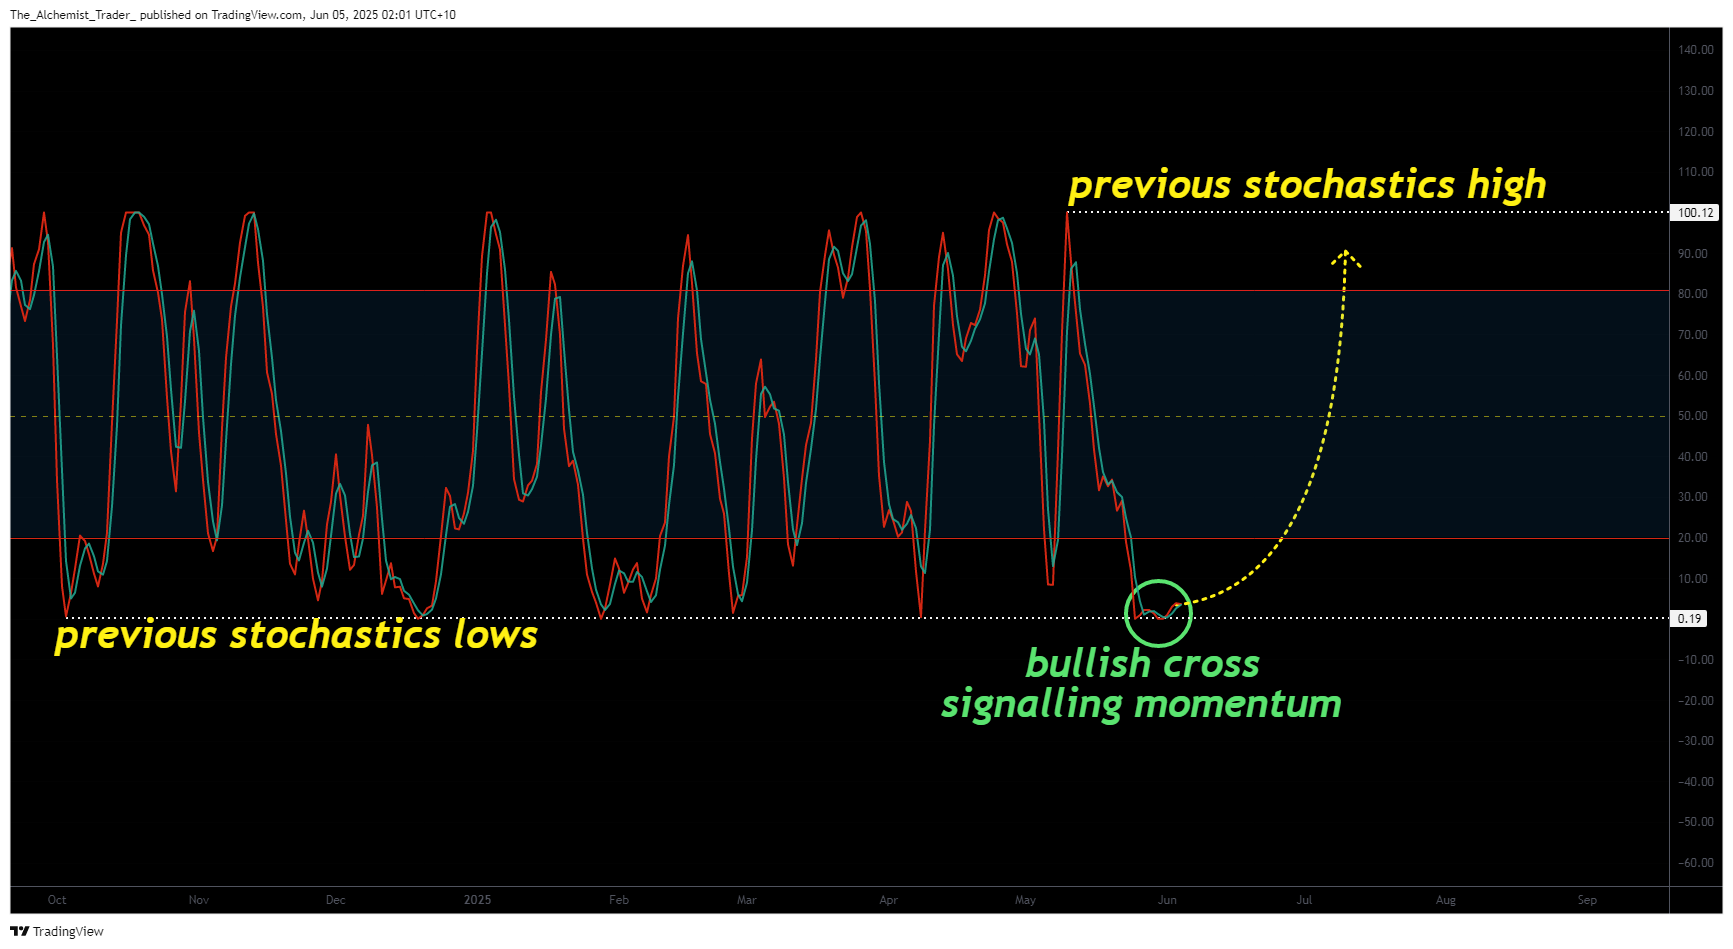
DOGEUSDT Stochastics RSI, Source: TradingView
From a momentum perspective, the Stochastic RSI is generating a highly relevant signal. Currently positioned around 19, DOGE is in extremely oversold territory, a region where historical reversals have frequently originated. The key element here is not just the absolute value, but the bullish crossover that is currently developing. If the stochastic crosses above the 20 line, momentum confirmation occurs, and in past cycles, this has correlated strongly with explosive upside moves. In essence, the momentum reset appears to be complete, and conditions are favorable for renewed acceleration.
Moreover, price action is not exhibiting weakness despite the correction from the $0.23 level. Conversely, it is respecting support and consolidating constructively, as evidenced by multiple daily closes above the $0.16 level. If this cluster holds and the market structure remains intact, a new bullish leg towards $0.23 becomes the base case. And beyond that? The relative absence of resistance between $0.23 and $0.30 opens the door to a more substantial continuation.
What to Expect in the Coming Price Action:
The next few days will be crucial for Dogecoin. A sustained defense of the $0.16 support cluster, particularly around the POC and 0.618 Fib, would establish favorable conditions for a long trade entry, targeting a return to the recent swing high at $0.23. If that level is breached, a rapid acceleration towards $0.30 is likely.
Momentum confirmation via the Stochastic RSI crossover above 20 will serve as a key secondary signal. If both support holds and momentum confirms, DOGE could be entering a new phase of its market cycle, characterized by higher lows, trend continuation, and increasing volume driving the next leg upward.
Traders should closely monitor price behavior around the support cluster, analyze candle structure on the daily timeframe, and watch for confirmation from momentum indicators such as the Stochastic RSI. While a failed hold below $0.16 would invalidate this setup, current conditions favor bullish continuation and a potential macro trend reversal.
 Coinpaper
 Finance Feeds
 CryptoNewsLand
 Deythere
 36Crypto
 TurkishNY Radio
 Bitcoin Sistemi
 CoinoMedia
 Yellow News


