

Dogecoin's price is currently trading above a significant ascending trendline established since October 2024. This trendline has repeatedly acted as support during previous market corrections.
The weekly chart shows upward consolidation along this trendline, indicating buyer accumulation at this price level.
Currently trading near $0.16–$0.18, Dogecoin aligns closely with the 0.5 Fibonacci retracement level of $0.16537. This region has historically provided support and may continue to do so. Analysts suggest a potential short-term pullback to $0.14 could precede a price rebound if the trendline holds.
Fibonacci Levels and Resistance Zones Suggest $0.30 Target
Fibonacci retracement levels highlight key price areas where traders often seek reversals. Dogecoin recently bounced off the 0.5 Fib level. Further resistance areas lie at the 0.618 level ($0.21317) and the 0.786 level ($0.30602). A break above $0.213 could pave the way for a test of the $0.30 mark.
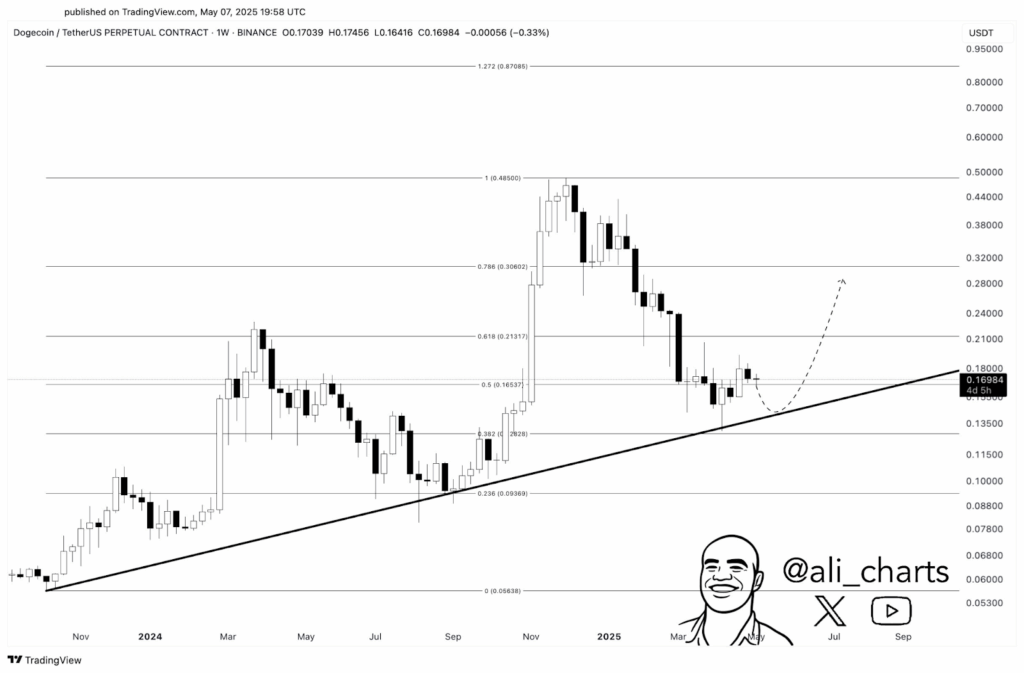
Source: Ali/X
The chart's upward trajectory suggests continued growth if the $0.14–$0.16 support area remains intact. This pattern points towards potential price movements to $0.24 and then $0.30, aligning with historical resistance levels observed during previous Dogecoin price increases.
On-Chain Activity and Trading Volume Support Bullish Outlook
In the past 24 hours, Dogecoin experienced a 13.69% price increase, reaching $0.2079 (Coingecko data). The seven-day increase of 4.16% suggests continued buyer interest.
Trading volume has also risen to $1.77 billion, coinciding with a broader market surge led by Bitcoin (which subsequently exceeded $101,000 following a U.S.-U.K. trade deal announcement).
A significant transaction involving 807,378,538 DOGE tokens (approximately $149.76 million) between unknown wallets has generated market speculation. While the purpose remains unclear, large transactions often spark debate, with analysts suggesting potential portfolio rebalancing or strategic market maneuvering by a major investor.
Dogecoin Price Technical Pattern Breakout and Market Sentiment
Crypto analyst Trader Tardigrade noted Dogecoin's recent breakout from a diamond bottom pattern on the daily chart, a technical indicator often associated with trend reversals. Following consolidation from mid-March to early May, Dogecoin surpassed the pattern's upper boundary, accompanied by a surge in trading volume.
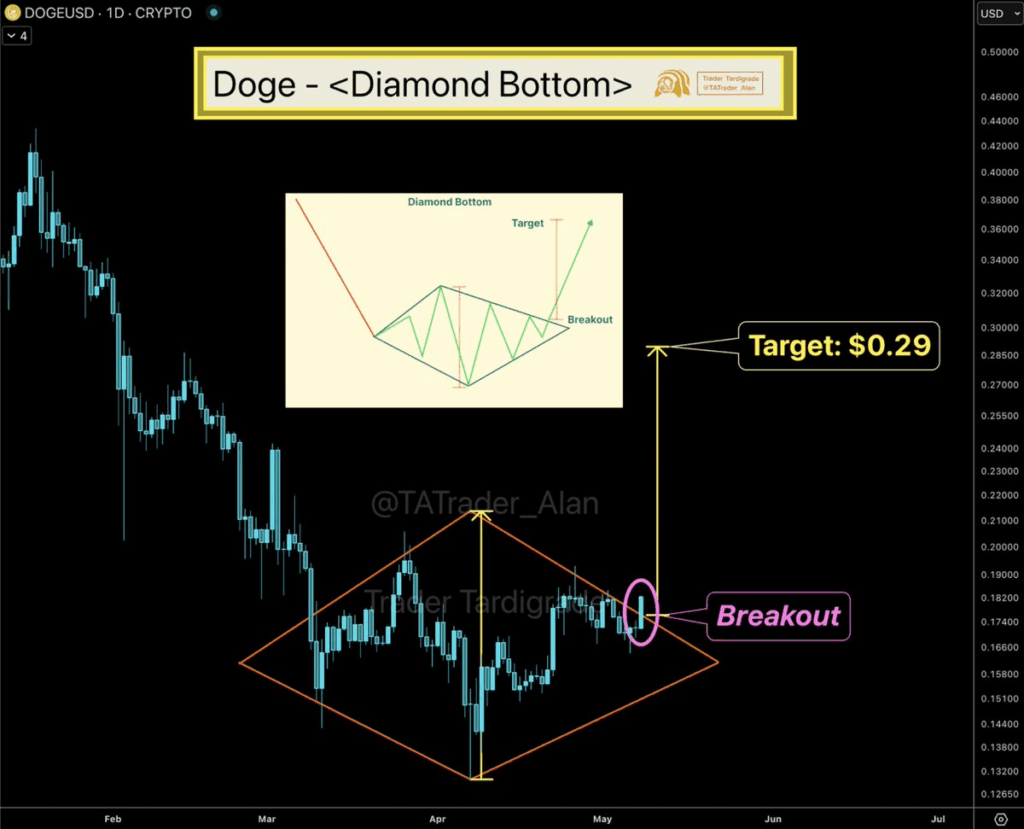
Source: Trader Tardigrade/X
Analysts also highlight a recurring 29-day cycle in Dogecoin's Relative Strength Index (RSI), where bullish divergence has frequently preceded price rallies. The current RSI activity aligns with this cycle, suggesting a potential rally towards $0.29—approximately 52% above current prices and close to the $0.30 breakout target.
Coinglass data reveals increased interest in Dogecoin positions. Open interest is up 12.40% to $1.91 billion, while total trading volume increased by 38.02% to $3.06 billion. The options market also saw a 4.09% increase in volume and a 30.58% rise in open interest, reaching 337,880 contracts.
 Coinpaper
 Finance Feeds
 CryptoNewsLand
 Deythere
 36Crypto
 TurkishNY Radio
 Bitcoin Sistemi
 CoinoMedia
 Yellow News


