

Dogecoin, currently priced at $0.1700, has recently navigated a period of mixed signals. While experiencing some outflows, intriguing technical patterns have emerged, suggesting the potential for a significant price shift in the near future.
Fueled by the possibility of a 260% surge, some investors are speculating that Dogecoin's price could even reach $1.25. As the cryptocurrency hovers near critical support levels, many are closely monitoring its price action for the next decisive move.
Dogecoin Outflows Suggest Bullish Sentiment
Despite recent price fluctuations, Dogecoin has demonstrated potential bullish momentum, driven by substantial exchange outflows. Data from CoinGlass reveals that over $5 billion worth of DOGE has been withdrawn from exchanges since November of the previous year. Notably, net outflows have surged to over $658 million since the beginning of May.
This trend indicates increasing investor confidence, as a greater amount of DOGE is being moved into self-custody, effectively reducing the available market supply. This reduced supply on exchanges can often exert upward pressure on prices, potentially acting as a key catalyst for Dogecoin's future price appreciation. The ongoing outflows suggest that investors are optimistic about the long-term potential of DOGE, further solidifying the bullish outlook.
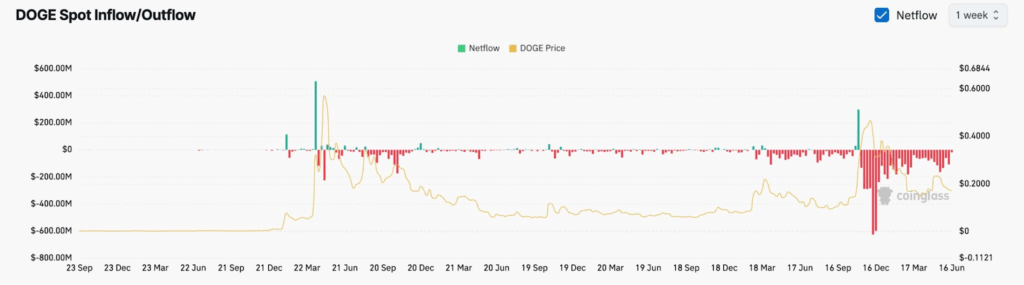
Source: CoinGlass
Adding to the positive indicators, Dogecoin's funding rate remains positive at 0.0056%, a trend that has persisted since June 13. A positive funding rate typically signifies that investors anticipate future price increases, contributing to the overall optimistic sentiment surrounding DOGE.
Dogecoin Price Predicted to Surge by 260%
Prominent market analyst Javon Marks has projected a potential 260% surge in Dogecoin's price, potentially reaching $1.25 from its current level of $0.1700. This optimistic forecast is predicated on the observation of a falling wedge pattern, a technical formation that often suggests an impending breakout.
A successful breakout above the upper trendline of the falling wedge could propel Dogecoin to $0.2600, representing a 52% increase. However, maintaining support at the $0.1700 level is crucial. A drop below $0.1535 would potentially invalidate the bullish outlook.
Analysis of the long-term chart reveals a bullish market structure characterized by higher highs and higher lows, indicating a clear uptrend. Key resistance levels are identified at $0.215711 and $0.268533, driven by Fibonacci extensions. A decisive break above these levels could trigger further significant gains.
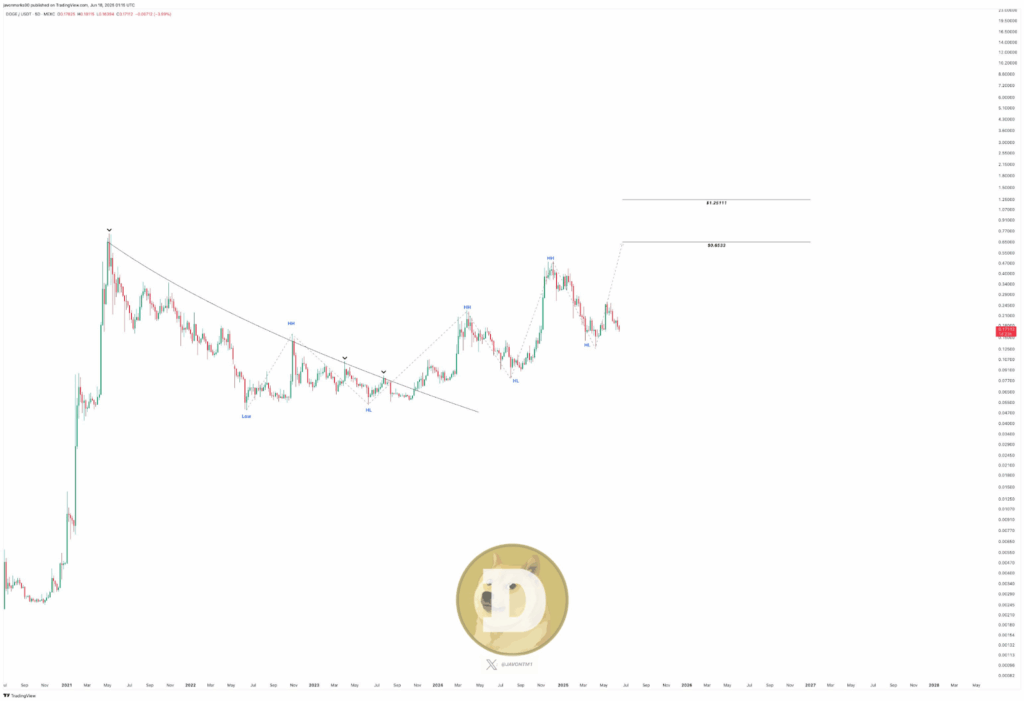
Source: X
Overall market sentiment surrounding Dogecoin remains positive, reflecting continued accumulation. If the established support levels hold firm, further upward momentum is a distinct possibility. However, a failure to overcome resistance or a breach of key lows could signal a potential reversal of the current trend.
Dogecoin's Derivatives Market Shows Rising Confidence
The derivatives market for Dogecoin reflects increasing optimism, with a positive funding rate suggesting that investors anticipate price appreciation in the near term. This indicates that traders are actively betting on higher prices, contributing to the prevailing bullish sentiment.
Furthermore, open interest in Dogecoin futures has increased by 0.22%, reaching $1.78 billion, signaling that a greater number of traders are committing to long positions.
However, the options market has experienced a notable decline in volume, down by 93.92% to $72.39 million. Despite this, options open interest has increased by 3.16% to $1.45 million, suggesting that traders are strategically positioning themselves for potential price movements.
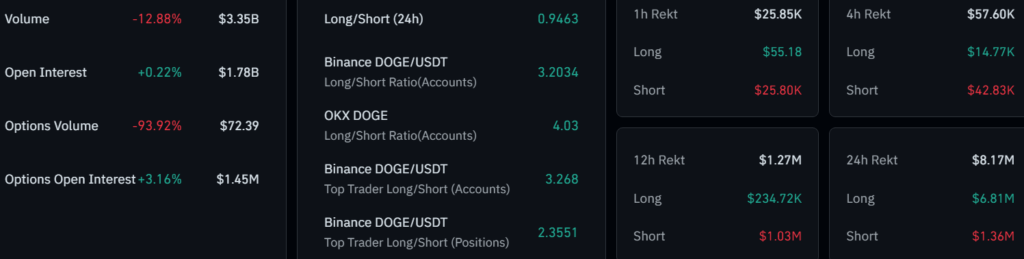
Source: CoinGlass
Analyzing the 4-hour "rekt" data reveals total liquidations of $57.60K, with short positions facing greater losses ($42.83K). This data potentially indicates an impending breakout, potentially driving Dogecoin's price towards the $0.2600 target.
Dogecoin Price Technical Indicators Show Consolidation and Potential Reversal
The 4-hour price chart for Dogecoin indicates that the price is currently consolidating within a narrow range between $0.1700 and $0.1720. This consolidation suggests a period of indecision or two-way expansion.
The current price is marginally negative by 0.40%, reflecting market uncertainty. A breakout above the resistance level at $0.1720 could be a positive indicator of a short-term upswing, while a fall below $0.1700 may signal further drawdown.
The Moving Average Convergence Divergence (MACD) exhibits slight bearish tendencies, as the MACD line is currently below the signal line. However, the difference is minimal, suggesting that the market is not in a strong negative phase. A move of the MACD above the signal line could indicate a transition to a bullish trend.
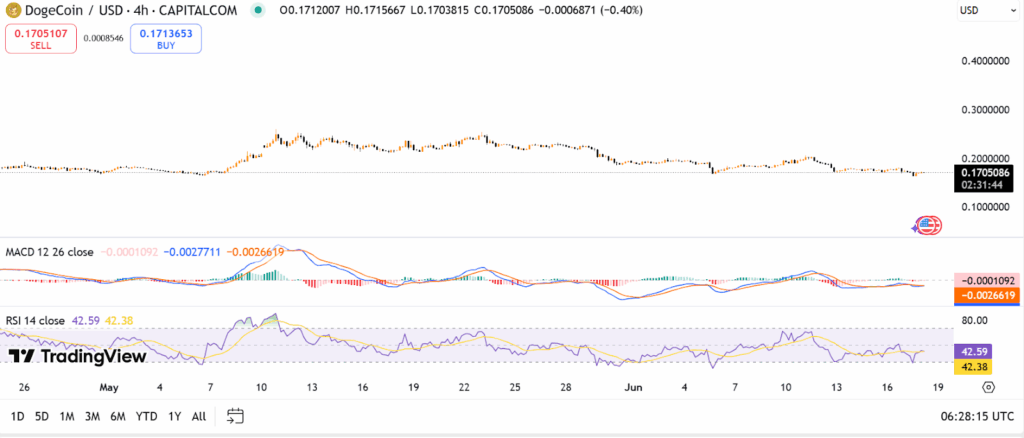
Source: TradingView
The Relative Strength Index (RSI) is at 42.59, indicating a neutral market condition. An increase above 50 would suggest a potential positive trend, while a decline below 40 would indicate a possible downtrend.
A break above $0.1720 will likely be the next important step, with a potential target at $0.2600. Conversely, a drop below $0.1700 might present a reversal of the current progression.
 Crypto Front News
 Coindoo
 CoinCryptoNews
 Coinlive.me
 Crypto Economy
 Coindoo.com
 Cointelegraph
 Crypto News Land
 BlockchainReporter


