

Dogecoin's price has exhibited significant movement over the past week, demonstrating an upward trajectory between August 6th and August 10th. The cryptocurrency appreciated from approximately $0.19 to over $0.23, representing a 7.3% gain over seven days and a 12.5% increase over the preceding 30 days.
Despite a recent pullback to $0.22, Dogecoin's price action continues to garner attention. Analysts suggest a bullish pattern is developing, hinting at potential breakout opportunities.
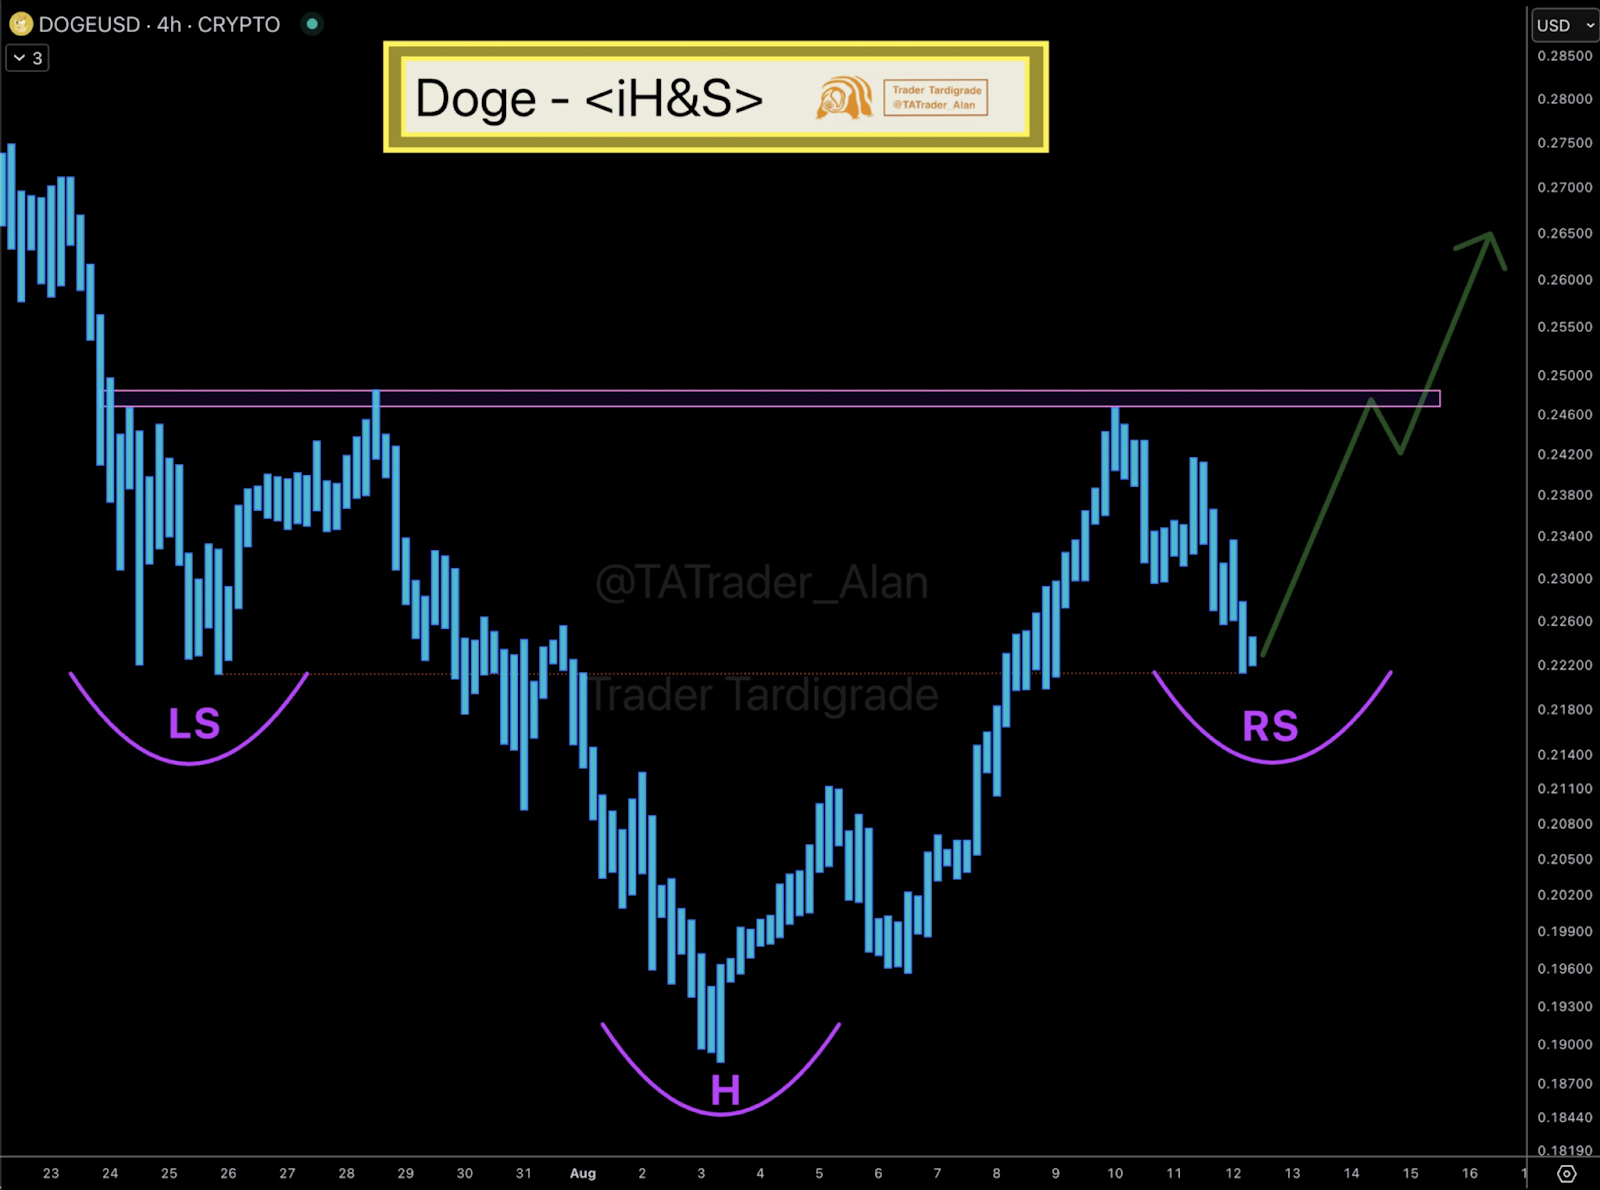
Formation of Inverse Head and Shoulders Pattern
Technical analysis, as highlighted by Trader Tardigrade, suggests Dogecoin may be forming an inverse head-and-shoulders pattern. This pattern is a widely recognized bullish reversal signal. The left shoulder and head appear to have already formed, with the right shoulder currently in development.
Source: X
A critical level to monitor is the neckline, situated around $0.2460. This neckline connects the peak price of the left shoulder with that of the head, making it a crucial resistance level. A successful breakout above $0.2460, supported by strong volume, would signal a potential shift in momentum, potentially reversing the preceding downward trend.
Such a breakout could target a price point of approximately $0.26, representing a potential upside of 17.4% from the current price of $0.22. Confirmation of the price reversal requires the right shoulder to form above the head. Therefore, traders are advised to closely observe price action near $0.2460 for indications of either a breakout or a failure to overcome resistance.
RSI and Bull Flag Suggest Healthy Continuation
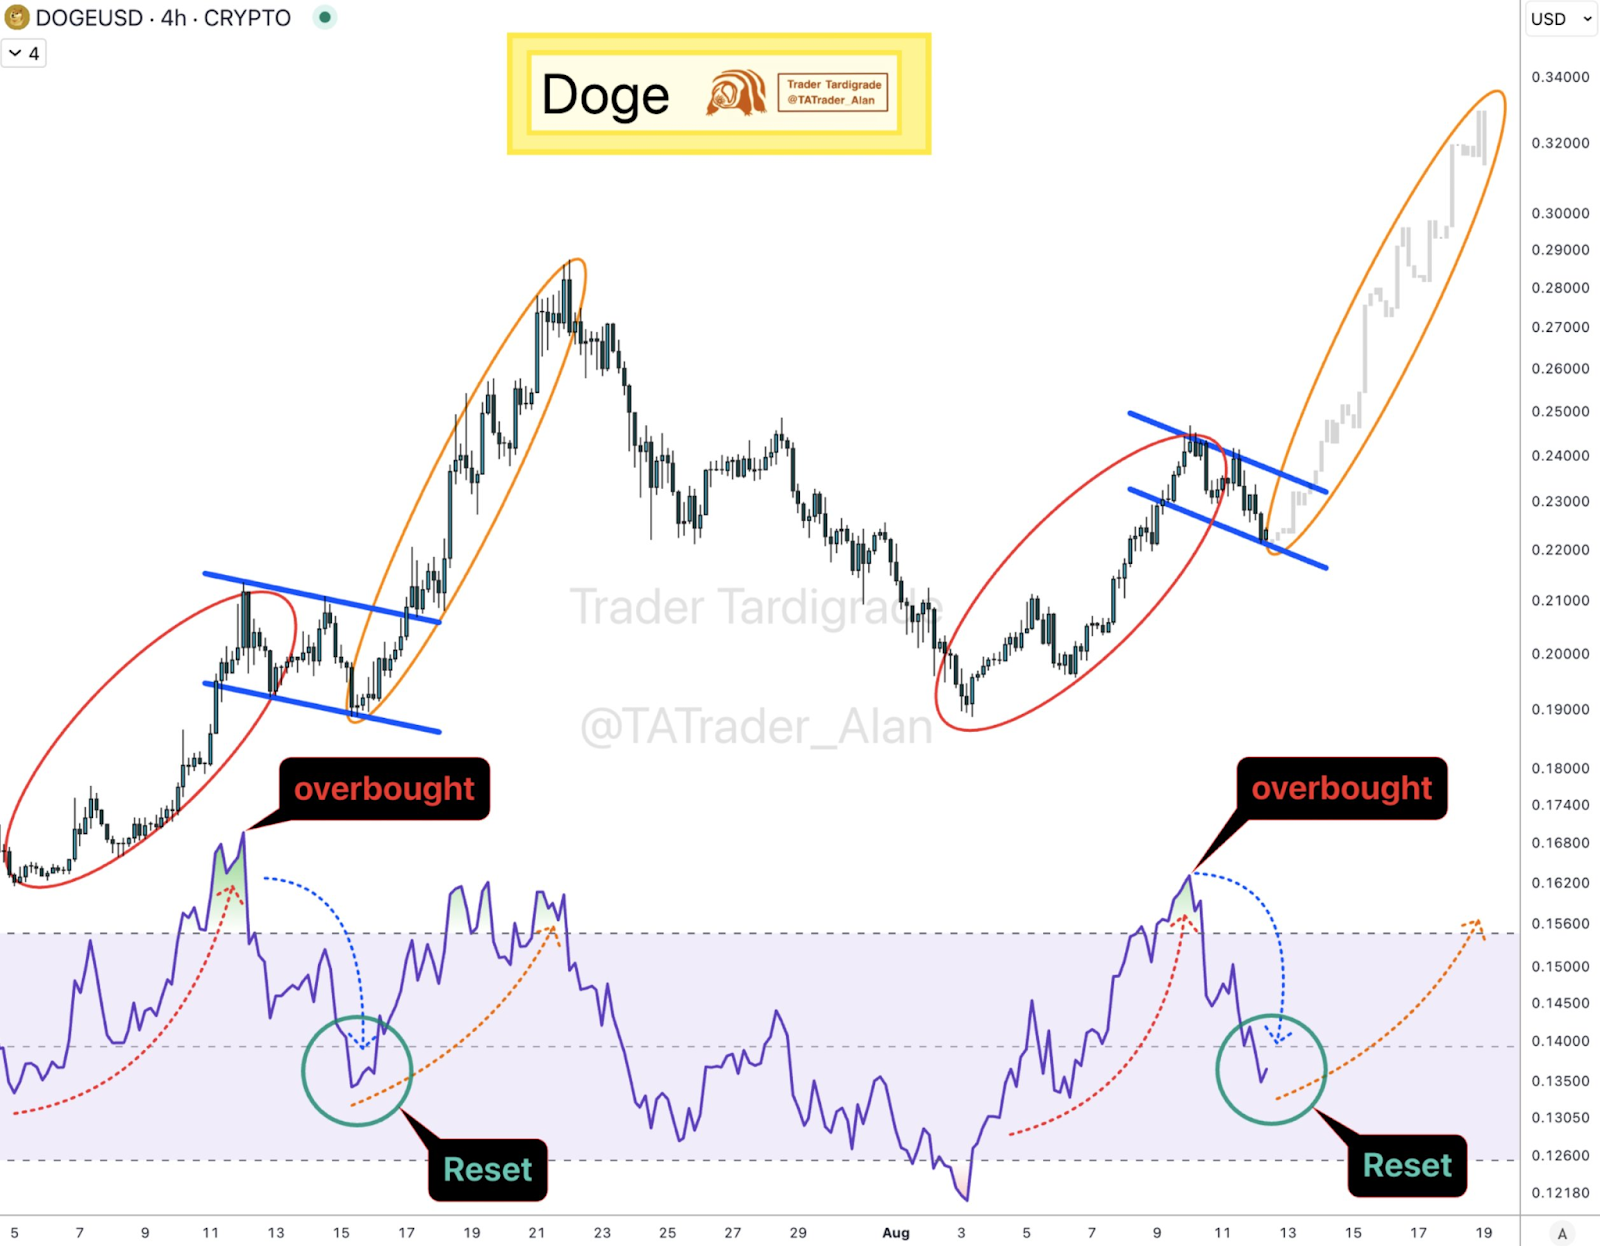
Further analysis from Trader Tardigrade indicates a correction in Dogecoin's Relative Strength Index (RSI), which recently dipped below 50. This suggests a reset from previously overbought conditions. Technical analysis generally views such resets favorably, as they can allow an asset to regain strength for a potential rally. This reset may provide Dogecoin with the momentum needed for a renewed upward surge.
Source: X
Additionally, the price chart reveals a bull flag consolidation pattern. This pattern, characterized by a downward-sloping channel, typically follows a strong upward move. The price action within this consolidation phase suggests Dogecoin is experiencing a brief pause before potentially resuming its upward trend.
Bull flags are considered continuation patterns, and a breakout from this phase could propel the price higher. Assuming the price successfully breaches the consolidation pattern with significant volume, Dogecoin could resume its upward trajectory, potentially reaching the $0.26 level and beyond.
Strong Network Activity Supports Price Surge
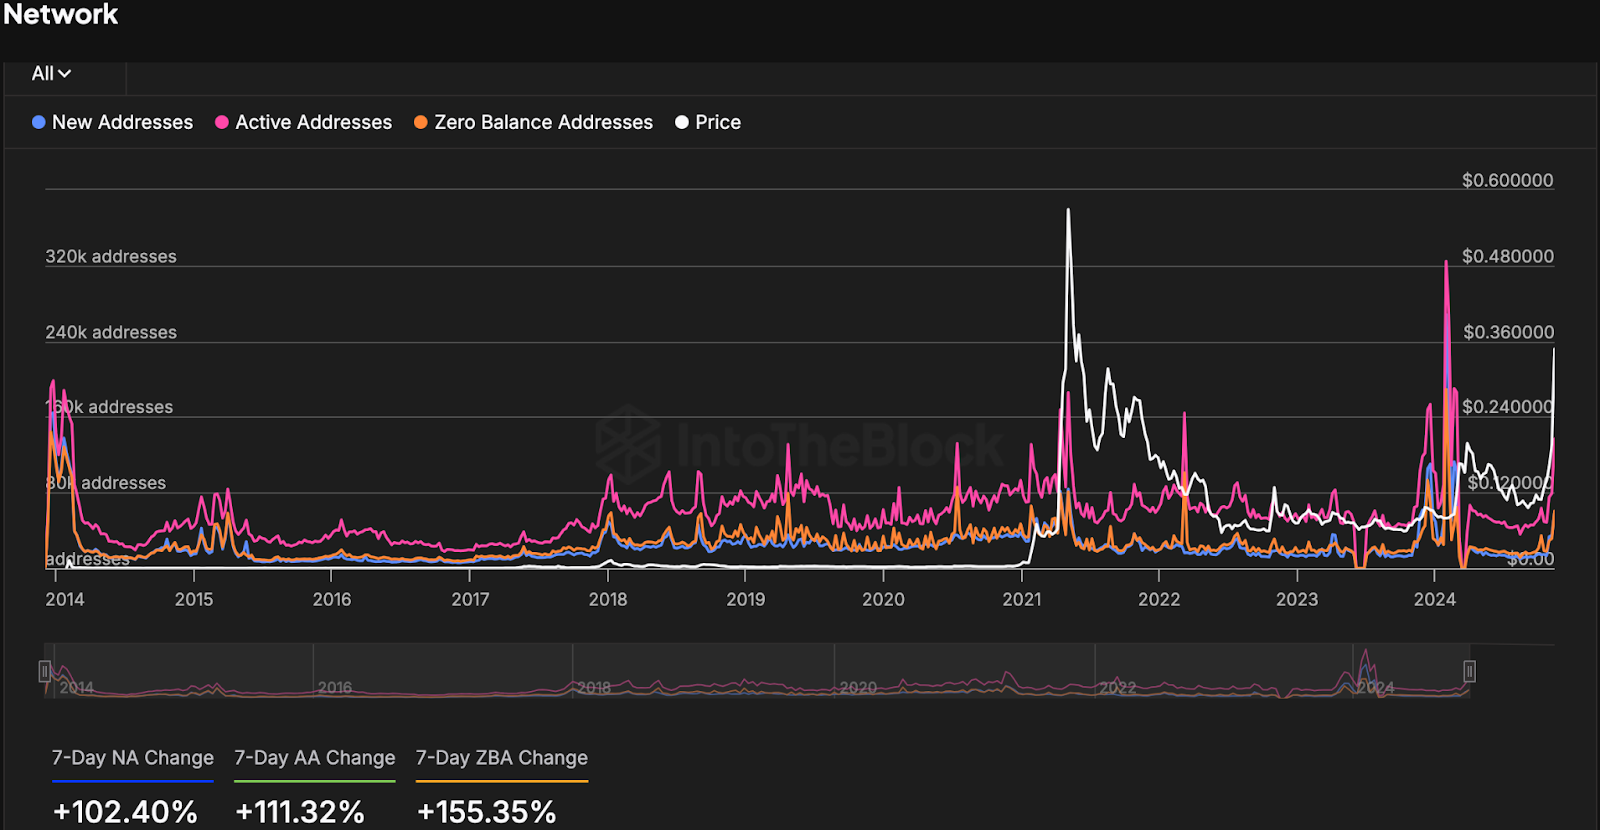
It's important to note that the recent surge in Dogecoin's price is supported by increasing network activity. Data from IntoTheBlock indicates a rise in key indicators such as New Addresses, Active Addresses, and Zero Balance Addresses. In the past seven days, New Addresses have increased by 102.4%, Active Addresses have risen by 111.32%, and Zero Balance Addresses have grown by 155.35%.
Source: IntoTheBlock
This positive correlation between price appreciation and heightened network usage suggests that the current bullish trend is not solely driven by speculation but is also fueled by growing demand and usage of the Dogecoin network.
 Crypto Front News
 Coindoo
 CoinCryptoNews
 Coinlive.me
 Crypto Economy
 Coindoo.com
 Cointelegraph
 Crypto News Land
 BlockchainReporter


