

Dogecoin finds itself at a pivotal moment as the DOGE price delicately balances above a crucial support level within a descending triangle pattern. The prevailing bearish momentum suggests a potential breakdown towards the $0.145 mark.
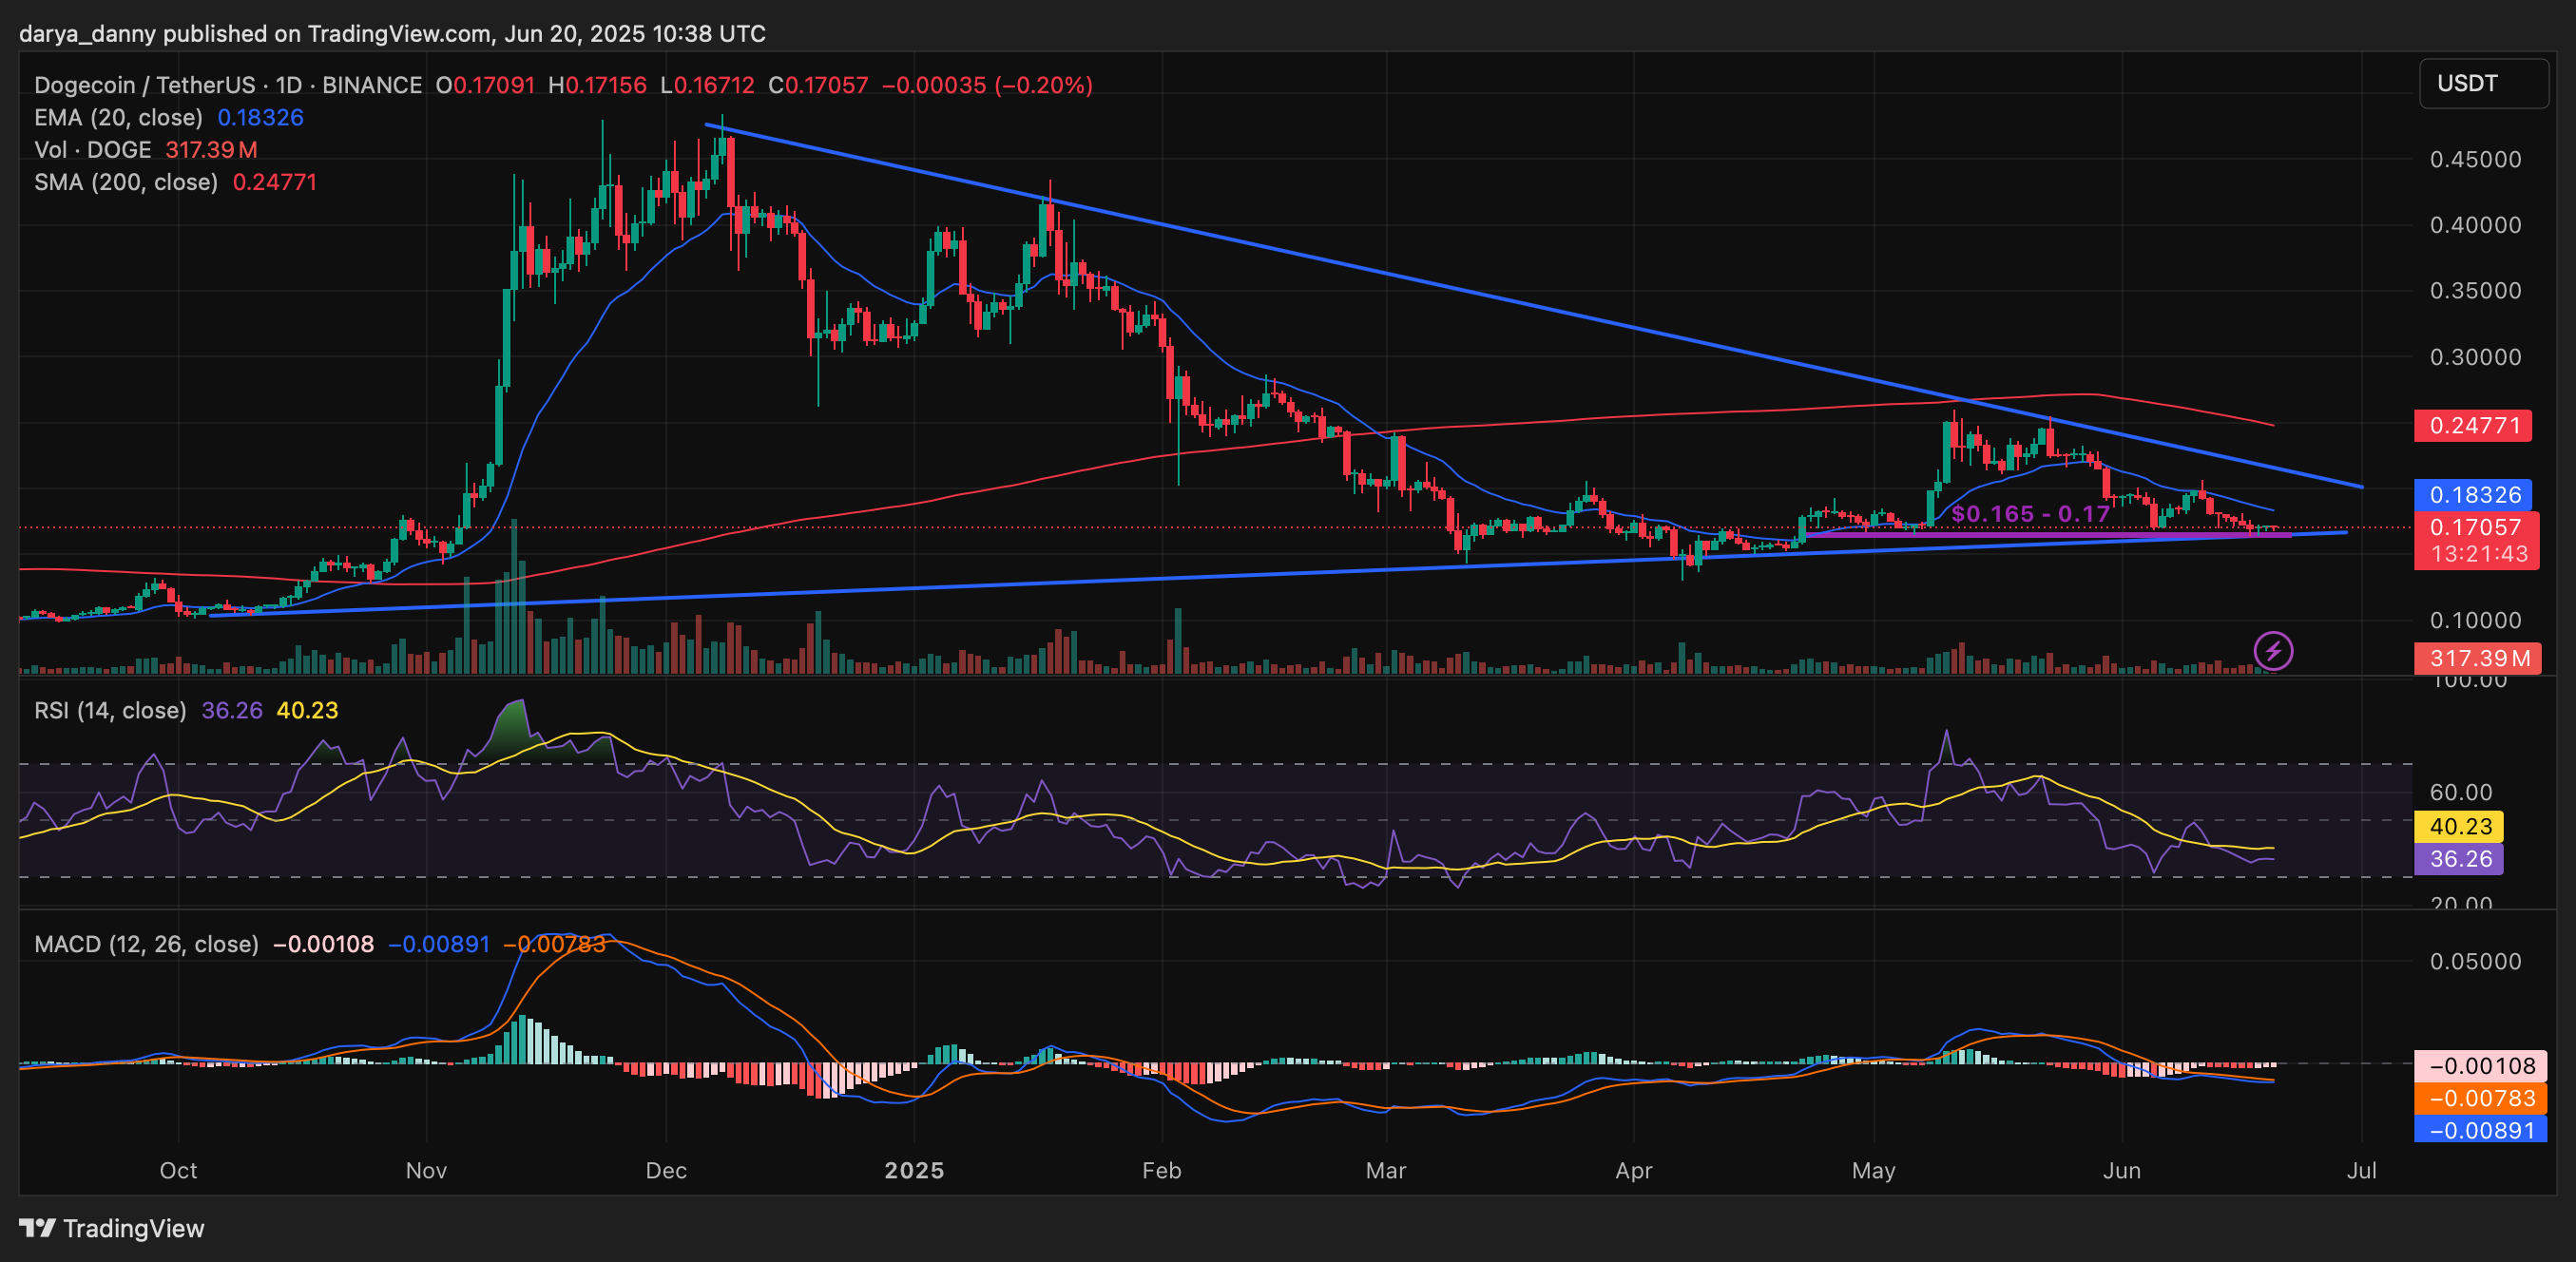
On the daily chart, Dogecoin (DOGE) has established a descending triangle pattern, characterized by price action compressing towards its apex. This pattern is typically indicative of a bearish continuation, and its formation within a broader downtrend is underscored by the price trading significantly below the 200-day Simple Moving Average (SMA), currently around $0.248.
The immediate horizontal support zone lies between $0.165 and $0.17. The price has rebounded from this support on multiple occasions and is currently retesting it. Small-bodied candles are forming just above this zone, aligning with a broader support area defined by the lower boundary of the descending triangle.
This signifies that Dogecoin's price is approaching a potential breaking point. A breach below this support level would confirm a bearish breakdown from the descending triangle pattern, potentially triggering increased selling pressure.
If the memecoin's price closes below the $0.165 threshold, it could pave the way for a descent towards the next substantial support level around $0.145, which corresponds to a previous demand zone within the triangle.
However, as long as the $0.165–$0.17 zone remains intact, a range-bound bounce remains a possibility. Nevertheless, the overall outlook leans bearish unless the descending triangle pattern is invalidated by a breakout above the descending trendline resistance, confirmed by a daily close above it.
From an indicator perspective, the bearish scenario seems more probable at this juncture. The price is trading well below both the short-term 20-day Exponential Moving Average (EMA) and the long-term 200-day SMA, both of which are trending downwards. The Relative Strength Index (RSI) hovers around 36, nearing oversold territory. The Moving Average Convergence Divergence (MACD) also remains in negative territory, with the signal line positioned above the MACD line, and no bullish crossover in sight.
 Crypto Front News
 Coindoo
 CoinCryptoNews
 Coinlive.me
 Crypto Economy
 Coindoo.com
 Cointelegraph
 Crypto News Land
 BlockchainReporter


