

Dogecoin (DOGE) is currently trading around $0.2278, consolidating just below a key resistance level following a recent rebound. Both daily and hourly charts show signs of strength, but also significant hesitation. Bulls are defending key support zones, but struggle to break through a defined resistance band.
Dogecoin Price Prediction: Can DOGE Surpass the $0.233 Resistance?
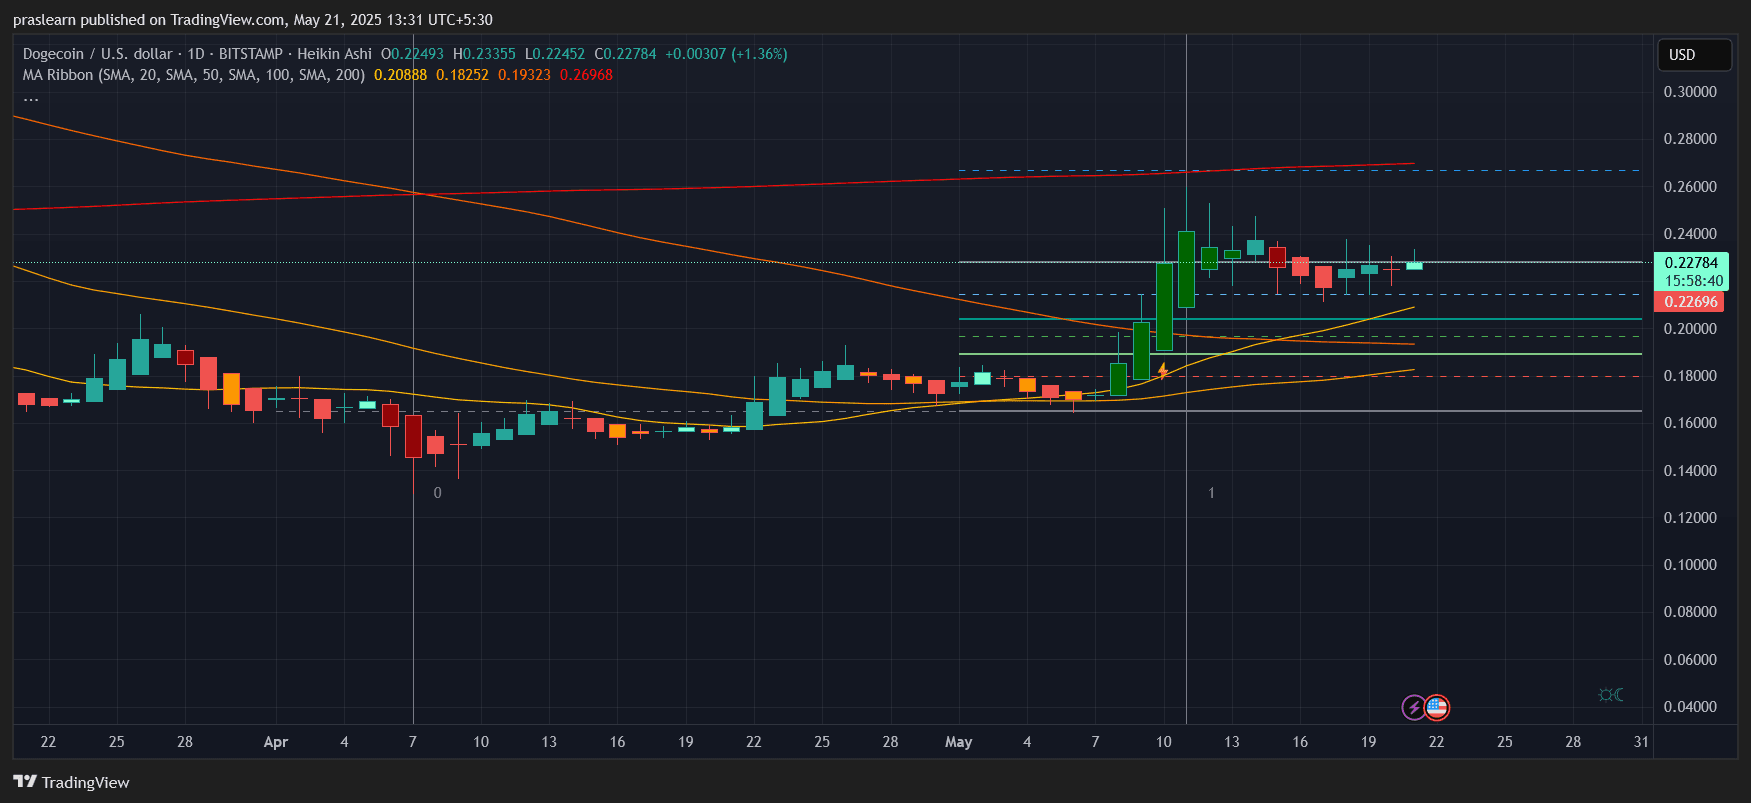
The daily chart shows DOGE trading within a tight channel after a strong rally earlier this month that pushed prices above $0.26, followed by a pullback. Currently, DOGE trades between its 50-day SMA ($0.193) and 200-day SMA ($0.269), a zone of significant price contention.
The 20-day moving average sits at $0.208, with DOGE comfortably above. Historically, sustained trading above the 20-SMA has preceded further upward movement. The last breakout from this level (May 9th) propelled DOGE from $0.19 to $0.29 – a more than 52% increase.
A daily close above $0.2335 could signal a short-term breakout, potentially pushing DOGE towards $0.25, and possibly even back to $0.265 if momentum persists.
Hourly Chart Analysis
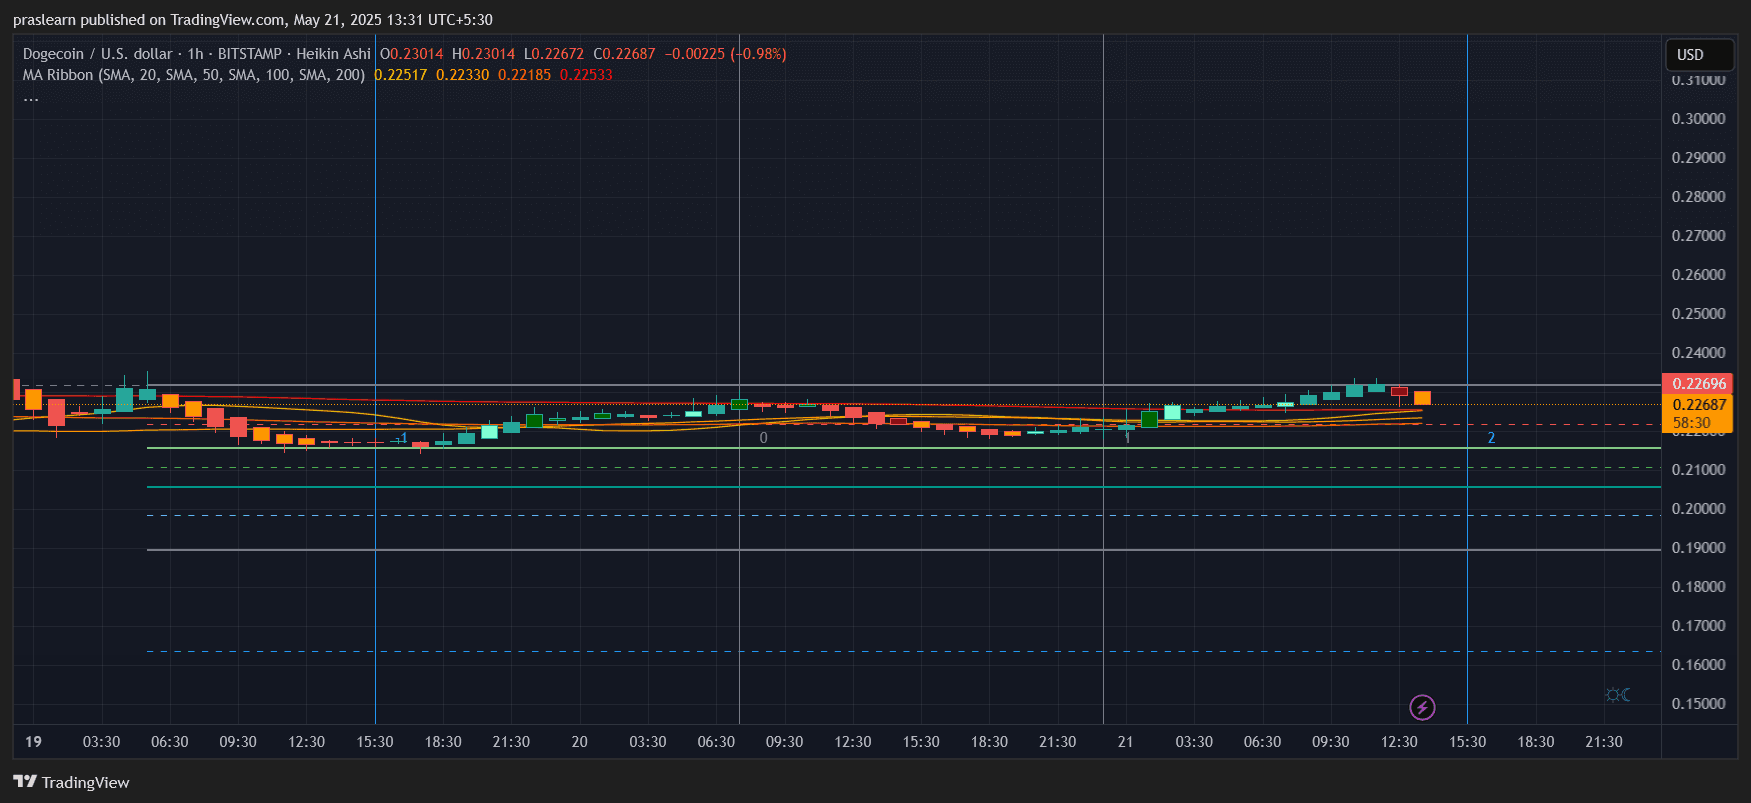
The hourly chart reveals a recent rejection from $0.2301, a level tested repeatedly in the last 24 hours. The subsequent pullback to $0.2266 rests near a cluster of short-term moving averages (SMA 20 to 100) between $0.223 and $0.225, creating a support ribbon.
This support zone is crucial. A break below could send DOGE to the next hourly support at $0.2218, then $0.2175. However, a bounce with volume from this support could retest $0.230 and potentially break through, forming a bullish continuation pattern.
Momentum Assessment
The price action is squeezed between narrowing support and resistance levels, forming a symmetrical triangle on the hourly chart. This pattern often precedes a significant breakout.
Potential move calculation (based on triangle height):
High: $0.230
Low: $0.217
Height: $0.013
Breakout Target = $0.230 + $0.013 = $0.243
This suggests a short-term target of $0.243 if DOGE breaks upward. Conversely, a breakdown below $0.217 could push DOGE back to $0.208 or even $0.198.
Dogecoin Price Prediction for This Week
Sustained trading above $0.225 and a break above $0.233 could lead to a rally towards the $0.243-$0.25 range. This aligns with a potential resurgence in altcoin sentiment, given a slight decline in BTC dominance.
However, failure to hold $0.221 could trigger a downtrend towards $0.208, the daily 20-SMA and a key structural support level.
Summary:
Bullish above: $0.233
Bearish below: $0.221
Short-Term Target: $0.243
Medium-Term Ceiling: $0.265 (200 SMA)
Strong Support: $0.208, $0.198
Should You Buy DOGE?
Dogecoin is at a critical juncture. Rising volume, moving average support, and a forming bullish triangle suggest a higher probability of a breakout, but confirmation is vital. Look for a decisive close above $0.233 with strong volume. This could signal a significant upward move.
Existing holders should consider tightening stop-losses below $0.221. Potential buyers should wait for a confirmed breakout – late entries can be costly if momentum fades. The future price movement remains uncertain.
 Coinpaper
 Finance Feeds
 CryptoNewsLand
 Deythere
 36Crypto
 TurkishNY Radio
 Bitcoin Sistemi
 CoinoMedia
 Yellow News


