

Dogecoin (DOGE) price action has captured renewed attention across the crypto and meme coin markets. Following confirmation of a DOGE breakout, bullish crossovers, coupled with supportive structural patterns, are leading analysts to predict a potential upswing of 284% for the leading meme token.
Dogecoin Price Breakout and Retest Confirmation
Analyst Trader Tardigrade highlighted that Dogecoin's price has recently broken through the upper boundary of a 146-day ascending parallel channel. This channel has guided DOGE's price movement since early March, characterized by consistently higher lows and a gradual squeeze towards the upper resistance level.
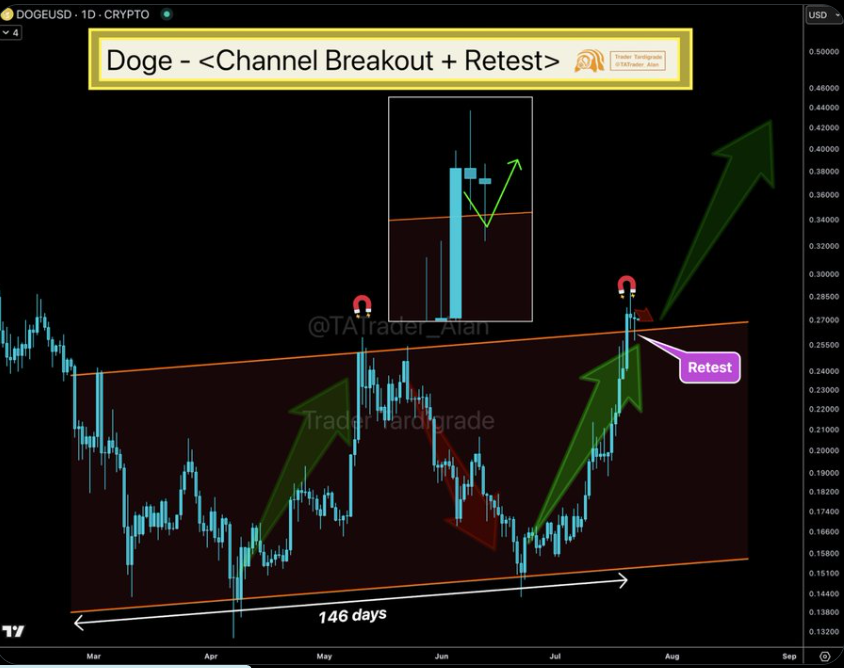
In late July, the meme coin decisively pushed beyond this upper line. Subsequently, the price retraced to retest the breakout level around $0.26. The breakout's validity was reinforced by the meme coin's price stabilizing shortly above the channel top after this successful retest. Furthermore, historical data suggests that such a pattern – an early breakout followed by a calm retest – often precedes a bullish continuation. The daily chart shows DOGE consistently recording higher lows, indicating sustained buyer pressure despite periodic corrections.
Bullish MACD Cross Aligns With Historical Rallies
The Moving Average Convergence Divergence (MACD) indicator on the weekly chart has displayed a bullish crossover, with the MACD line crossing above the signal line. This event is typically associated with a shift in market trend towards a more bullish outlook. Analyst MikyBull Crypto pointed out that this marks the third significant crossover within the last 24 months.
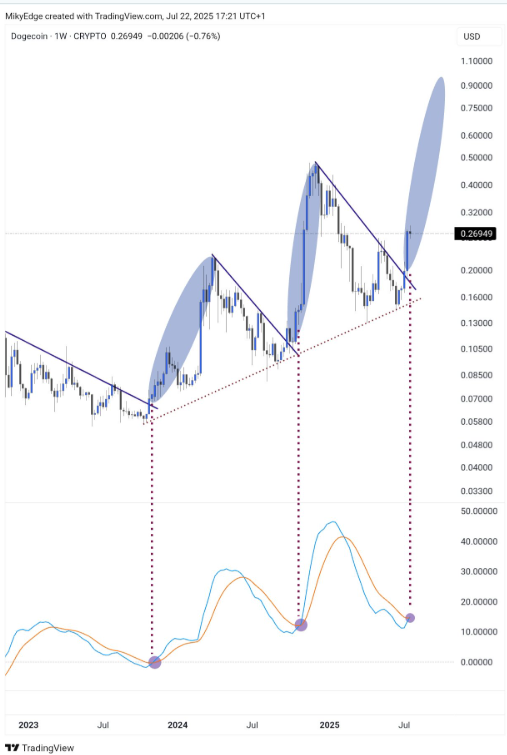
Notably, the two previous bullish MACD crossovers coincided with price surges exceeding 200%. In both instances, the crossover aligned with trendline increases and breakouts, suggesting a continuation of the prevailing technical trend. The current crossover originates from a low base, further strengthening the possibility of a substantial price expansion if the trend persists.
Multi-Year Descending Wedge Break Signals New Cycle
Another analyst observed on the monthly chart that Dogecoin's price has broken out of a multi-year descending wedge, a pattern defining the broader trend since the 2021 peak. This formation compressed price movement between lower highs and horizontal support. The resulting volatility contraction culminated in the recent breakout.
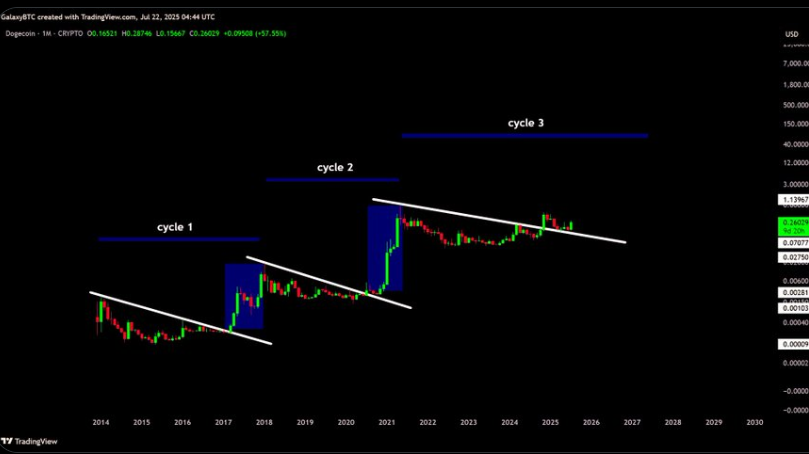
The wedge spanned over three years, extending from mid-2022 to mid-2025. This breakout marks the beginning of what the analyst terms "Cycle 3." Both previous cycles, initiated by wedge breakouts, led to new all-time highs. The technical structure and long-term chart symmetry suggest that Dogecoin's price may be entering an expansion phase. The historical pattern of breakout cycles provides a framework for projecting potential upside trajectories in the current phase.
Dogecoin Price Prediction Points to 284% Upside
Drawing parallels with past rallies originating from similar levels, Dogecoin's price could potentially rally towards $1. This target represents a 284.62% gain from the recent breakout level around $0.26. Supporting the $1 target, a recent analysis indicates a confirmed parabolic bullish structure. Intermediate targets have been set at $0.52 and $0.68, driven by strong bullish momentum that could pave the way for DOGE to reach the $1 mark.
The top meme coin has experienced a 26% rally in the past week, reaching a weekly high of $0.282 and stabilizing at $0.2556 at press time. This volatility is fueled by growing market interest and increased 24-hour trading volume, reaching approximately $3.13 billion.
 Crypto Front News
 Coindoo
 CoinCryptoNews
 Coinlive.me
 Crypto Economy
 Coindoo.com
 Cointelegraph
 Crypto News Land
 BlockchainReporter


