

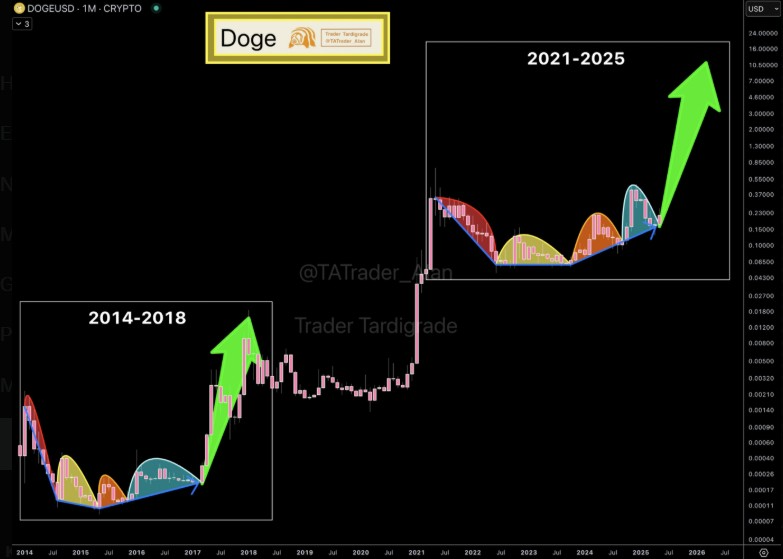
Dogecoin (DOGE) is attracting renewed attention from market analysts. Long-term charts reveal a recurring pattern, sparking speculation about a potential upward breakout, reminiscent of its 2018 rally.
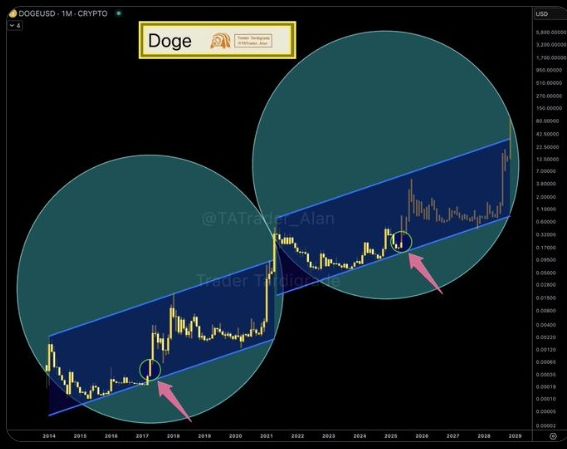
Technical analysis shows Dogecoin has twice rebounded from the lower boundary of a rising channel on the monthly logarithmic chart, each time preceding a significant price surge. The first occurred between 2014 and 2018; a similar formation appears to be developing between 2021 and 2025. The striking similarity in price waves suggests a possible repeat breakout.
Dogecoin Price: A Recurring Chart Pattern Suggests a Cyclical Structure
On-chain data indicates a distinct cycle in Dogecoin's price history. From 2014 to 2018, DOGE steadily rose within a rising channel. After touching the channel's lower trendline, it rallied significantly in 2017-2018, suggesting a gradual build-up culminating in a high-volume surge. Analysts note a period of several years' consolidation before the decisive upward movement.
Source: X
After peaking in 2021, DOGE corrected and returned to its rising channel's starting point. Current market conditions are mirroring this previous cycle, hinting at the possibility of another substantial price move.
Key Support and Resistance Levels Consistent Across Cycles
Trader Alan's analysis highlights a trend channel showcasing the same key support and resistance zones observed in the previous cycle. From 2014 to 2018, DOGE traded extensively within its lower boundary, which provided support again in 2023-2024, according to analysts.
Source: X
In both cycles, a rebound from the lower trendline initiated a strong upward movement. Key reversal points, marked by circles, further validate the pattern and serve as potential entry signals for traders.
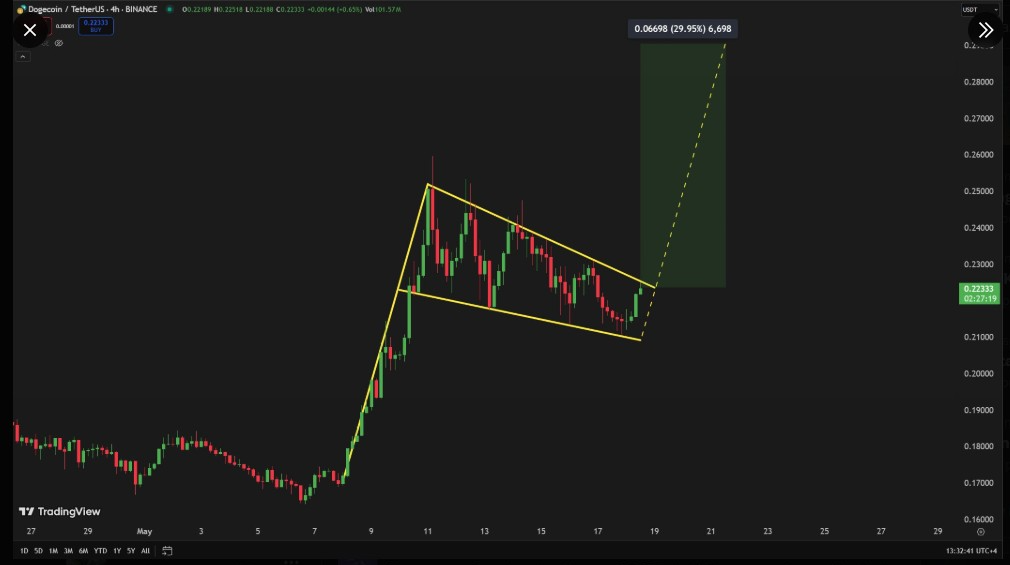
Dogecoin Bullish Flag Breakout: $0.29 Target – A Potential 30% Rally?
Analyst TheMoonCarl points to a recent bullish flag pattern on DOGE's 4-hour chart, a common signal of continued uptrend momentum. DOGE appears poised to break through this pattern's boundary.
Source: X
Technical analysis suggests a target price of $0.29, representing a 29.95% gain from the current price. This projection is based on the flagpole's height added to the breakout point. Sustained momentum and increased volume are crucial for reaching this target; low-volume breakouts might result in a "fakeout."
Market Context and Historical Timing Considerations
Analysis of past data reveals similar intervals between cycles. The 2014-2018 cycle took approximately four years to establish a base and break out. Similarly, the pattern observed since 2021 suggests a potential conclusion by 2025.
Supporting the bullish prediction, Dogecoin's price rallied 3% in the last 24 hours, reaching $0.22, with daily trading volume increasing by over 43%, suggesting building momentum towards a potential breakthrough.
 Coinpaper
 Finance Feeds
 CryptoNewsLand
 Deythere
 36Crypto
 TurkishNY Radio
 Bitcoin Sistemi
 CoinoMedia
 Yellow News


