

Interest in Dogecoin (DOGE) price is gaining momentum as certain patterns emerge, hinting at a potential continuation of the bullish trend. Should market conditions align favorably, recent movements combined with historical patterns suggest that the DOGE price may potentially surge towards the $5 mark.
Dogecoin Price Historical Pattern Repetition Signals Upside
Notably, analysis shared by CryptoElites highlights several instances where a specific pattern of Dogecoin price increases has recurred over time. Each cycle commenced with a symmetrical triangle formation, followed by a sharp, vertical rally.
According to this analysis, three such occurrences have already unfolded, with the latest structure currently forming at a higher price range.
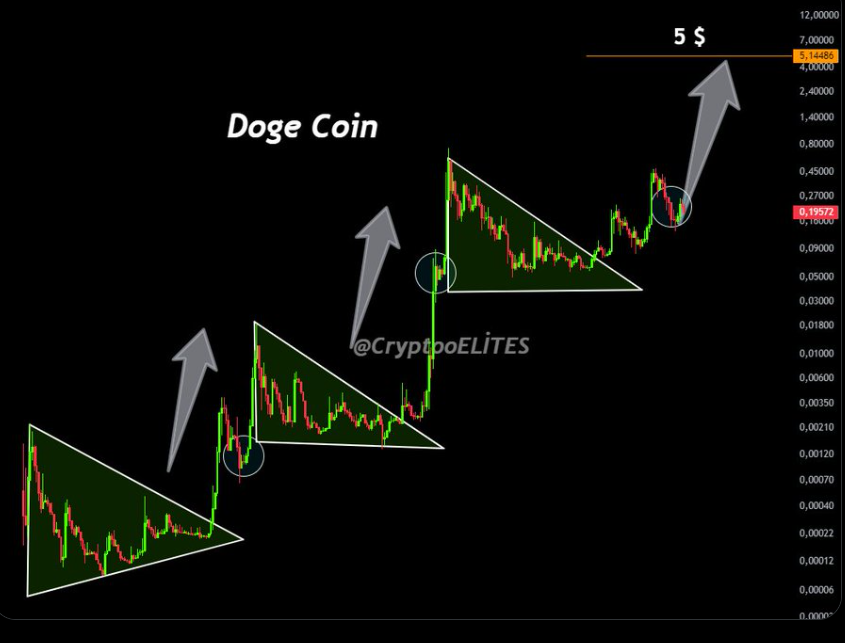
In addition, these triangular patterns denote periods of Dogecoin price consolidation that typically culminate in significant upward movements once resistance levels are breached. This recurring structure presents a possible roadmap for DOGE, indicating that another upward surge could follow if the current consolidation breaks in a similar fashion.
The projected level on this chart places a long-term target at $5, considerably above the current market price.
DOGE Bullish Structure Forms on Heikin Ashi H4 Chart
Furthermore, a separate 4-hour Heikin Ashi chart, analyzed by Trader Tardigrade, reveals a second triangle formation following the breakout of the earlier triangle. There are clear indications of consolidation within the DOGE price structure, as both support and resistance levels are converging.
Typically, this pattern precedes a period of strong bullishness and reduced volatility just before a trend reversal or continuation.
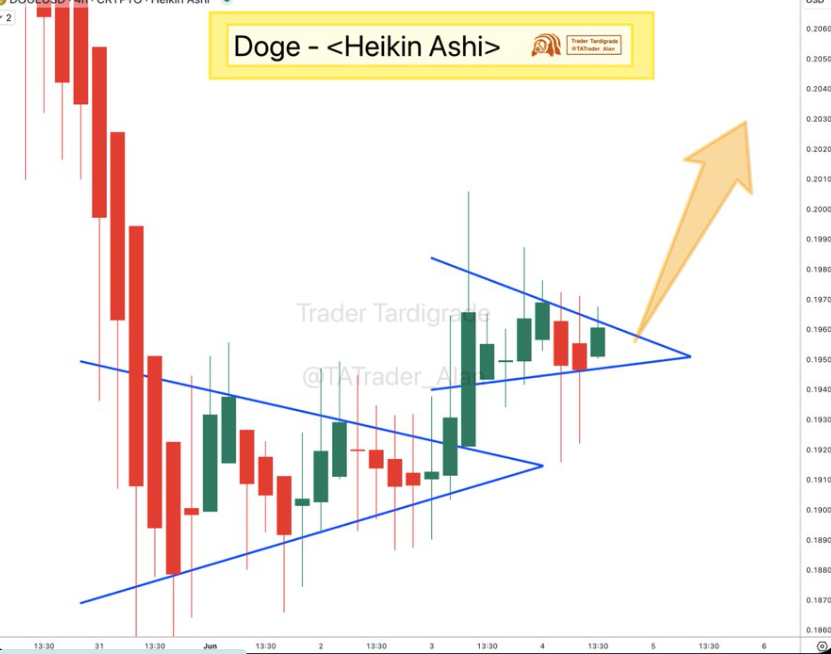
As Dogecoin price consolidated, it might be preparing to move above its short-term resistance. Should the upper edge of the triangle be surpassed, the asset could potentially surge to the $0.203 mark. Holding above the active ascending trendline at the $0.194 level would further confirm the structure’s validity.
DOGE Price Triangle Retest Supports Breakout Structure
Zooming into a lower timeframe view, Trader Tardigrade pointed out that Dogecoin price has successfully retested a symmetrical triangle pattern. This formation exhibited multiple touches on both support and resistance lines prior to the breakout. Following the breakout, the price retraced to the triangle’s upper boundary and subsequently bounced, confirming it as a new support zone.
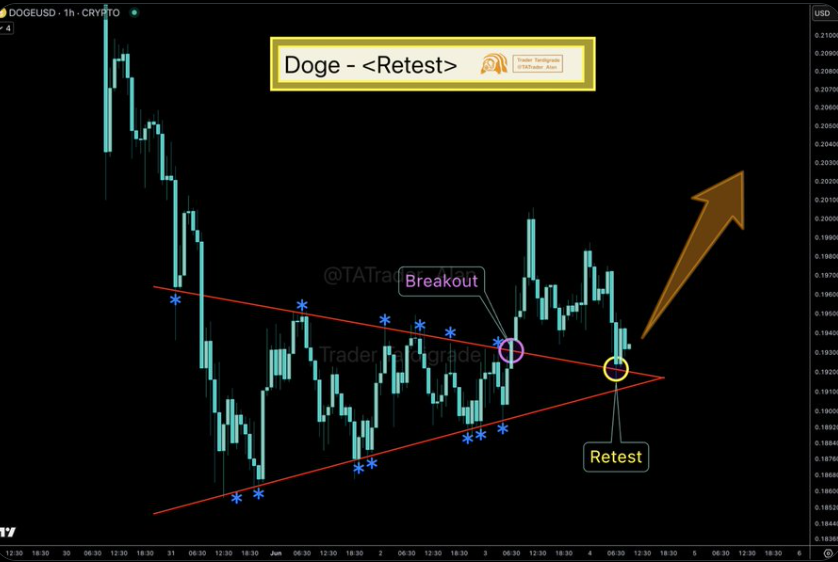
The retest was completed around the $0.191 level, which now serves as a structural foundation for the current bullish outlook. Technical setups that incorporate retests tend to validate the strength of breakouts, indicating that previous resistance levels have effectively transformed into support.
This pattern reinforces the probability of continued upward movement towards the $0.20–$0.203 resistance range in the short term.
Short-Term and Long-Term Targets Aligned With Chart Signals
In conclusion, the analysis from various sources suggests that Dogecoin price has the potential to increase in both the near and long term. In the short term, traders are aiming to overcome the resistance at approximately $0.203. Sustaining an uptrend at this level could propel the meme coin to reach previous highs and generate momentum for a rally towards $5.
Meanwhile, the long-term outlook, derived from historical breakout patterns, positions $5 as a potential macro-level target. While this scenario would necessitate sustained market support and broader adoption, the recurring nature of these breakout structures provides a technical basis for such speculation. Future price action near critical resistance levels will offer further confirmation of the trend direction.
At the time of writing, Dogecoin price was trading at approximately $0.1925, reflecting a 2.4% gain over the past 24 hours. This indicates a bullish trend, with key support established at $0.194 and resistance in the $0.198–$0.200 range.
 Coinpaper
 Finance Feeds
 CryptoNewsLand
 Deythere
 36Crypto
 TurkishNY Radio
 Bitcoin Sistemi
 CoinoMedia
 Yellow News


