

Dogecoin (DOGE) price is exhibiting patterns that suggest a potential significant upward movement, according to analysts observing its historical price behavior and momentum indicators.
Current technical analyses indicate that DOGE could potentially revisit the $1 level, based on recent Relative Strength Index (RSI) positioning, fractal symmetry, and key moving average levels.
Dogecoin Price RSI Structure Points To a Historical Pre-Rally Zone
The 3-day RSI for Dogecoin price has returned to the 50 level, a point it previously reached shortly before substantial price increases.
Analyst Trader Tardigrade noted that past rallies have often occurred when DOGE's RSI was in this mid-range. This pattern has been observed multiple times over several months.
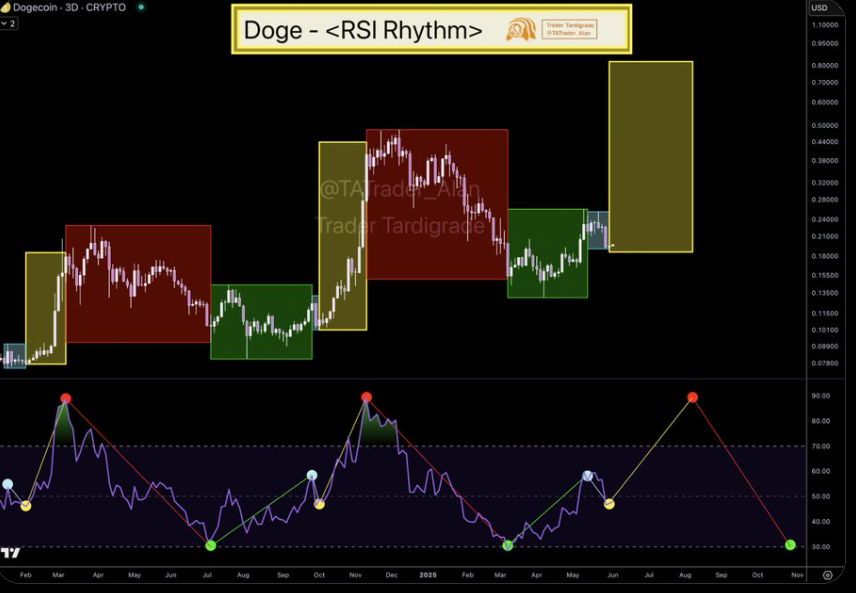
Additionally, the RSI chart also highlighted a "Yellow Zone" where the RSI remained near 50 for a period. DOGE price has now retraced to this level, mirroring past patterns.
Historically, these occurrences have been followed by rallies that propelled Dogecoin price upwards by over 100%. According to the analyst, focusing on this alignment could potentially bring the $1 target back into view.
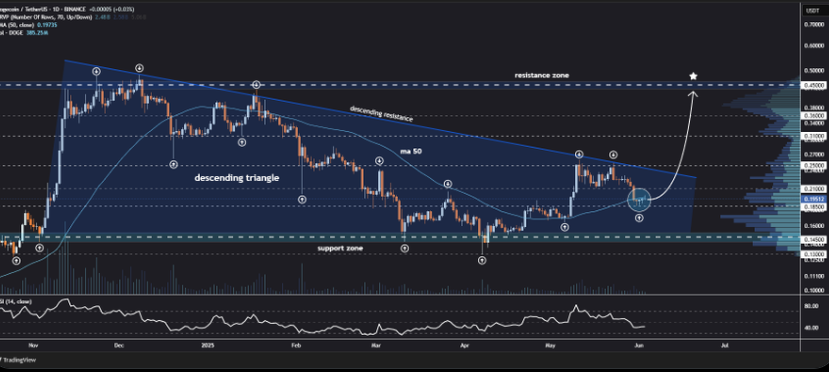
DOGE Price Fractal Pattern Resembles 2023 Breakout Structure
Another significant observation is the similarity between the current DOGE price action and the setup observed in late 2023. At that time, Dogecoin price formed a falling wedge pattern, followed by a brief consolidation phase before a surge toward the $0.45–$0.60 range. The present chart shows a comparable structure, with a triangle formation and consolidation zone currently in place.

This recurring pattern, known as a fractal in technical analysis, signifies the reappearance of similar formations under similar conditions. The chart illustrates resistance and support points in almost identical locations, suggesting that price behavior could potentially follow the previous trajectory. If this pattern persists, DOGE may be preparing for a sustained move beyond $0.60 in the near future.
Support at $0.185 Holds as MA 50 Forms a Breakout Barrier
Over the past two months, Dogecoin price has consistently found support at the $0.185 level, and its recent rebound from this point is noteworthy. The 50-day moving average (MA 50) is currently acting as a resistance level.
According to analyst Jonathan Carter, a decisive move above the MA 50 by the memecoin could signal a shift in the overall trend.
Furthermore, if DOGE price successfully breaks above the MA 50, potential targets include $0.21, $0.25, $0.31, $0.36, and $0.45. These levels align with volume clusters and historical resistance zones visible on the daily chart.
The price structure suggests that a sustained movement above $0.25 could pave the way toward $0.45 and eventually bring the $1 mark into focus.
Onchain Metrics Show Bullish Momentum
Dogecoin derivatives data indicates bullish momentum, with a volume increase of 8.89% to $3.28 billion and open interest up 2.65% at $2.11 billion. Options volume surged 98.13%, while options open interest jumped 33.20%. Long/short ratios on Binance and OKX exceed 2.5, favoring long positions.
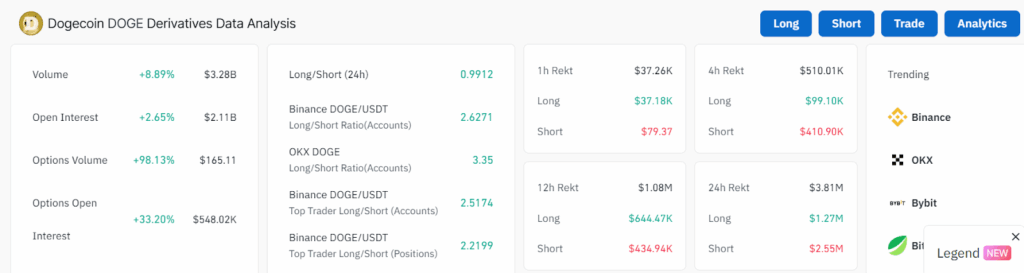
Additionally, over $3.8M in liquidations occurred in the past 24 hours, with $2.55M from short positions. This suggests increasing leverage and strong long positioning, particularly as top traders heavily favor long exposure across major platforms like Binance and OKX.
Adding to the bullish outlook, recent analysis indicates that Dogecoin price has exited Base 3 of a parabolic structure, with eyes now set on Base 4 above $1.00. Analysts cite historical reactions following 20/50 weekly SMA death crosses and highlight $0.187 as a key liquidity zone. Targets between $0.313 and $0.3597 are in focus, with a potential breakout toward $0.40 if resistance is cleared.
At the time of writing, Dogecoin price was trading at $0.1961, rebounding from a low of $0.1922 earlier in the day, demonstrating consistent intraday gains.
 Coinpaper
 Finance Feeds
 CryptoNewsLand
 Deythere
 36Crypto
 TurkishNY Radio
 Bitcoin Sistemi
 CoinoMedia
 Yellow News


