

Dogecoin (DOGE) has experienced a significant correction, falling over 70% from its 2021 high of $0.48, before entering a period of consolidation. A falling wedge pattern has emerged, suggesting a potential upward breakout based on historical price action.
On April 20th, DOGE traded around $0.15, aligning with the 200-day exponential moving average (EMA), a key support level.
Falling Wedge Formation and Support Levels
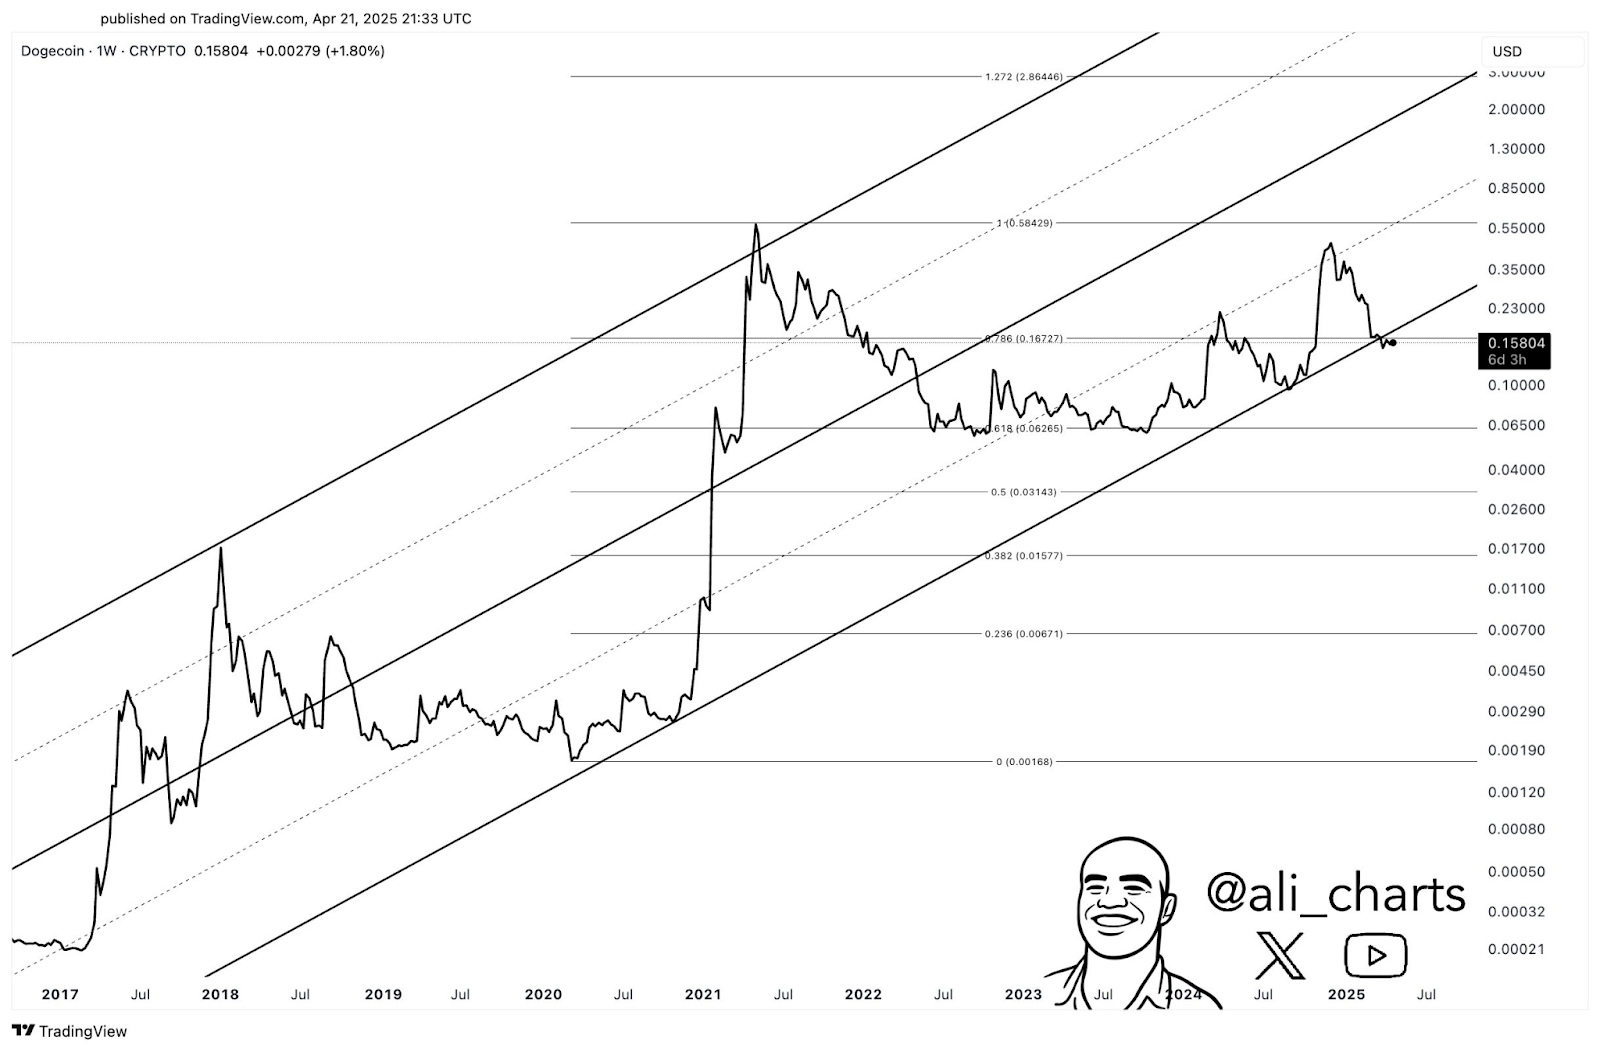
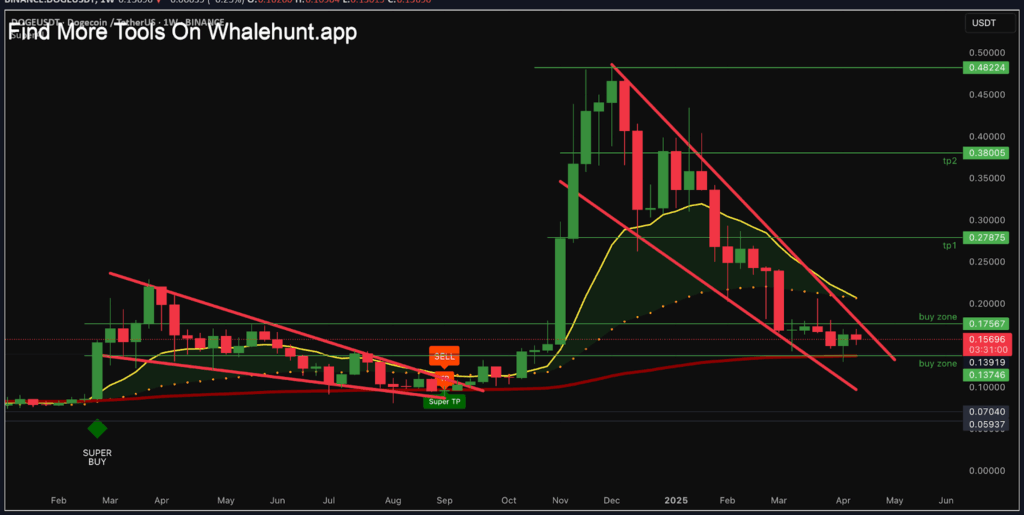
Dogecoin's price decline has formed a tightening falling wedge pattern. A breakout above the wedge's resistance, coupled with high volume, often signals a market reversal. The wedge is nearing its apex, indicating an imminent price movement, either upward or downward. Binance data shows DOGE trading within a range of $0.137 to $0.175, a historically significant accumulation zone for investors. Technical analyst @ali_charts notes DOGE's long-term price trajectory has remained within a logarithmic growth channel, with the price bouncing off the midline and upper bounds during previous rallies.
Source: X
DOGE's sustained position above the $0.15 200-day EMA, a crucial support level for traders, is noteworthy. A break below this level could trigger further downside pressure towards $0.135, signaling a weakening of bullish momentum.
Resistance Zones and Breakout Scenarios
The $0.17 resistance level has repeatedly thwarted upward price movements. A successful break and reclaim of this level could propel DOGE towards $0.23 and $0.27, significant historical reaction zones. A wedge breakout could lead to further price targets around $0.28, $0.38, and $0.48, aligning with previous profit-taking levels and high-volume trading areas.
Source: X
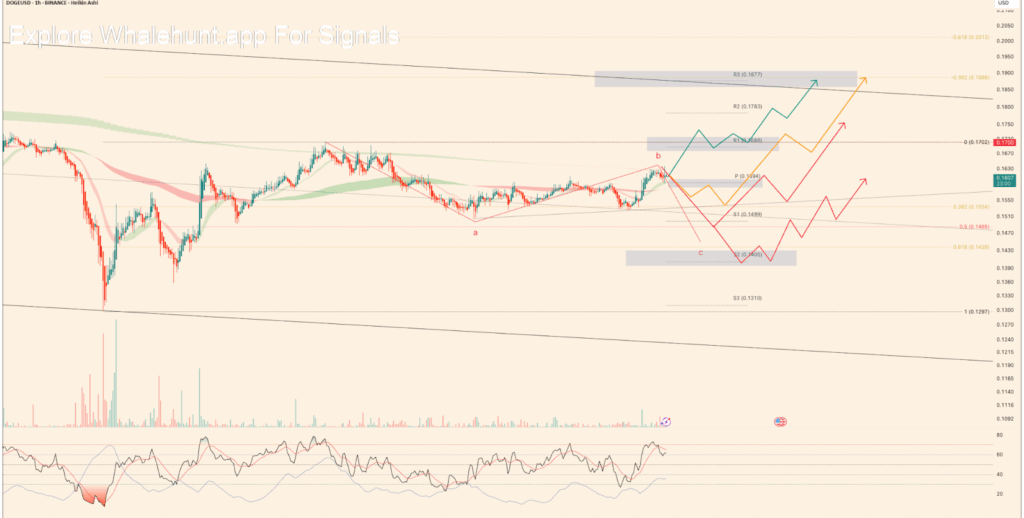
Short-term charts suggest DOGE might be forming an a-b-c corrective wave, typically preceding a trend continuation. The RSI on hourly charts recently approached overbought territory, hinting at a potential pullback before a sustained breakout.
Whale Activity and Accumulation
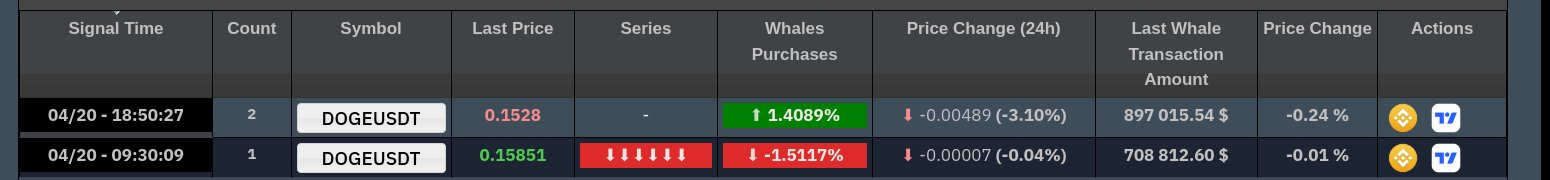
Whale transaction data from April 20th reveals a mixed signal. While whale purchases decreased (-1.51%) when DOGE traded at $0.1585 (09:30), they increased (1.40%) when the price dropped to $0.1528 later that day. A large transaction of nearly $900,000 suggests buying interest despite the price decline.
Source: X
This contrasting whale behavior reflects both short-term caution and long-term confidence. Despite early hesitancy, accumulation at lower prices suggests large holders anticipate a rebound or long-term recovery. Despite data inconsistencies, DOGE remained within its established buying range, with whale accumulation at lower prices suggesting price stability or potential upside.
Potential Outcomes and Key Levels
At the time of writing, DOGE traded near $0.156, with short-term support at $0.149 and $0.140. A breakout from the falling wedge, confirmed by increased volume above these levels, is possible. A close above the wedge resistance would target the $0.23–$0.27 zone. Conversely, a drop below $0.135 would likely negate the bullish scenario. The $0.135–$0.175 range is considered an ideal accumulation zone, requiring DOGE to remain above it to maintain buyer control.
Source: X
The 0.786 Fibonacci retracement level (around $0.157) serves as a key pivot point, historically triggering significant price reactions in DOGE. The continued formation of the wedge pattern, coupled with increased volume and whale activity, is crucial to watch for a potential breakout above the wedge's upper limit, signaling a potential bullish trend continuation.
The post A Look At Dogecoin’s Recovery Path 70% Below All-Time High appeared first on The Coin Republic.
 Coinpaper
 Finance Feeds
 CryptoNewsLand
 Deythere
 36Crypto
 TurkishNY Radio
 Bitcoin Sistemi
 CoinoMedia
 Yellow News


