

Dogecoin's MACD crossover and ascending histogram mirror previous breakout cycles, indicating renewed bullish momentum ahead of the $0.201 mark.
Price is sustaining above the 23.6% Fibonacci level and both major moving averages, establishing a robust structural foundation that could underpin the next parabolic surge.
Tight consolidation near the 50% Fibonacci retracement level, coupled with positive sentiment on platform X, suggests DOGE is poised for a breakout above key resistance.
Dogecoin is gaining momentum as price action consolidates above crucial support zones, and indicators suggest a resurgence of bullish sentiment. Technical signals derived from moving averages and momentum oscillators imply that DOGE may be approaching its next expansion phase.
MACD Behavior Aligns with Historical Breakout Cycles
Dogecoin’s weekly chart reveals a familiar pattern of market phases, with current conditions suggesting the potential for another upward movement. The price is currently trading just below the $0.191 level, which corresponds to the 50% Fibonacci retracement from its 2021 peak. This area is situated between stronger zones at $0.138 and $0.263, defining a critical mid-range zone within the broader cycle.
The MACD indicator plays a pivotal role in this analysis. A bullish crossover occurred in June 2023, initiating what analysts describe as a momentum launch. DOGE experienced a rapid ascent following this signal, reaching nearly $0.35 by the end of that year. After a correction in early 2025, a similar MACD structure began to materialize once more.
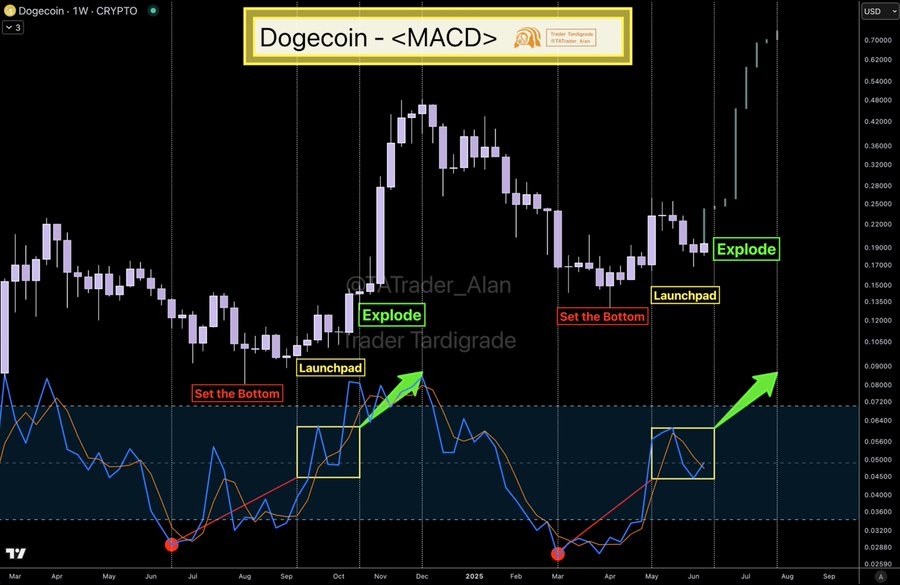
Source: (X)
This time, the histogram has turned green, and the MACD line is regaining position above the signal line. This pattern mirrors the earlier breakout cycle, where price expansion followed a bottoming crossover. With momentum shifting upward again, the weekly MACD suggests a repetition of the established pattern.
Dogecoin's behavior throughout each phase—bottoming, breakout, and pullback—has remained consistent. This repetition, coupled with a solid structure above long-term averages, lends credence to the developing trend.
Fibonacci Confluence and Moving Averages Strengthen Uptrend Scenario
DOGE is maintaining its position above the 23.6% Fibonacci level near $0.093, forming a reliable support base. The price is now testing the midpoint zone between the 50% and 61.8% retracement levels, a range that typically precedes directional confirmation. A breakthrough beyond $0.201 would signal strength and transform previous resistance into support.
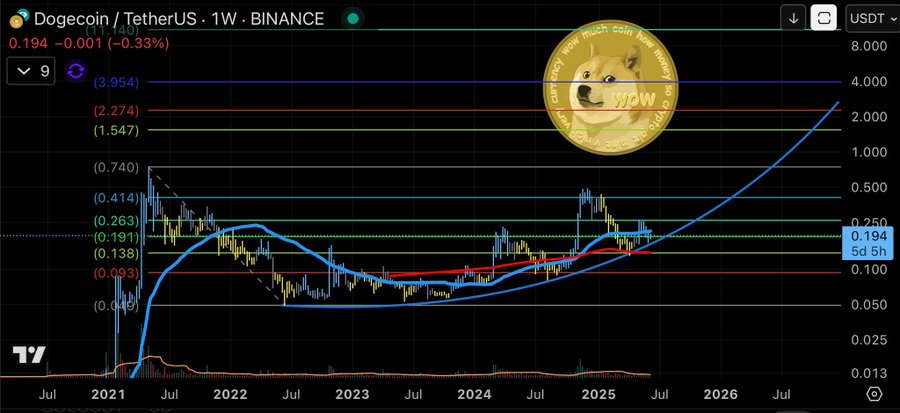
Source: (X)
Both the 50-week and 200-week moving averages reside below the current price, reinforcing the longer-term bullish outlook. The 200-week average continues its upward trajectory, visually projecting future targets beyond $2.00. Analysts highlight this dynamic as evidence of a structural uptrend with increasing maturity.
Volume remains stable across the board, suggesting that holders are positioning themselves for long-term gains rather than reacting to short-term fluctuations.
Analyst Sentiment on X Turns Bullish as Breakout Watch Intensifies
Technical analysts on platform X are closely monitoring Dogecoin’s weekly structure as it approaches key resistance levels. Several anticipate an upward continuation once $0.201 is decisively reclaimed. Analysts cite clean retests and a tightening structure as strong indicators that DOGE could soon resume its upward trajectory.
Sentiment leans bullish, supported by global brand recognition, historical rally patterns, and consistent Fibonacci alignment. With momentum on the rise and resistance levels within reach, the setup is building for a potential breakout. Traders are preparing for what could be the next significant move in Dogecoin's long-term cycle.
 AD HOC NEWS
 AD HOC NEWS
 Coinpaper
 Coinpaper
 Finance Feeds
 CryptoNewsLand
 Deythere
 36Crypto
 TurkishNY Radio


