

The memecoin market has shown resilience this week, with several major tokens experiencing consistent positive trading days. Dogecoin (DOGE) and Shiba Inu (SHIB) have exhibited increased volatility since the end of May, and technical indicators suggest a potential bullish reversal for both. This renewed activity has brought these memecoins back into the spotlight for investors and whales.
DOGE Memecoin Hints at Breakout Formation
Dogecoin's price has increased by over 5% in the last seven days, pushing it back above the $0.20 level. While its dominance in the memecoin market has stabilized at 0.8664%, its market capitalization stands at $29.97 billion, representing 46.497% of the total memecoin market.
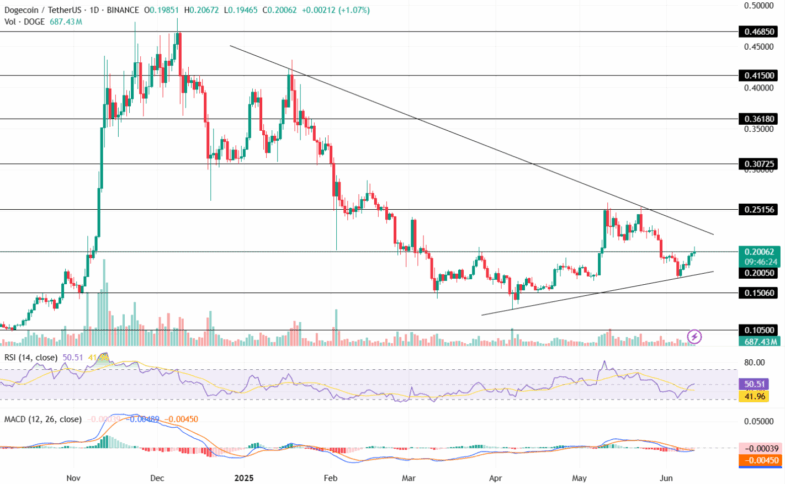
The Relative Strength Index (RSI) on the daily chart has broken above the neutral point after retesting oversold territory, currently sitting at 50.51. Additionally, a positive crossover has been observed on the average trendline, indicating a potentially bullish trend for the token.
The Moving Average Convergence Divergence (MACD) indicator shows a gradual decline in the red histogram, suggesting a rise in bullish momentum. With a bullish convergence in its averages, Dogecoin's price may sustain positive momentum this week.
If the bullish sentiment continues, the DOGE price could move towards the resistance trendline of its current triangle pattern. A surge in investor optimism could even push it past the $0.25156 mark. However, a market correction could lead to a retest of the $0.175 level.
Shiba Inu to Break Its Triangle Pattern?
In the past 24 hours, SHIB has gained approximately 2% in value, with a trading volume of $199.19 million. This brings the memecoin's market capitalization to $7.825 billion, with a dominance of 0.2262%.
SHIB has been trading within a triangle pattern since mid-April. The recent successful retest of the support trendline for the second time suggests a potential bullish outlook in the longer term.
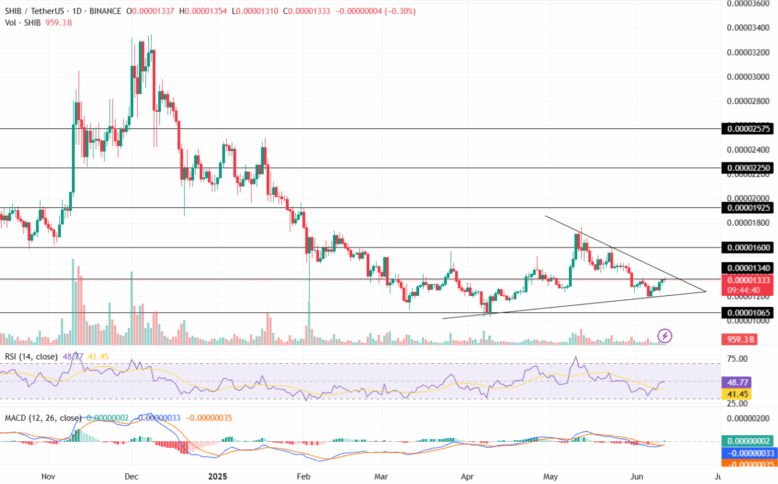
The RSI is trending upwards towards the neutral point after retesting oversold conditions, currently at 48.77. The trendline is moving sideways below the midpoint, indicating a possible cooling off in buying pressure.
Conversely, the MACD indicator displays a growing green histogram on the daily chart, signaling an increase in bullish sentiment for Shiba Inu. Given the current market sentiment, the likelihood of a bullish reversal for SHIB is quite high.
If SHIB can maintain its value above the $0.00001340 resistance level, it could retest the resistance trendline of the triangle pattern. A breakout could lead to upper resistance targets of $0.0000160 and $0.00001925. Conversely, a bearish pullback could test the crucial support line of the triangle pattern.
 AD HOC NEWS
 AD HOC NEWS
 Coinpaper
 Coinpaper
 Finance Feeds
 CryptoNewsLand
 Deythere
 36Crypto
 TurkishNY Radio


