

Dogecoin (DOGE) nears $0.16, poised for a potential breakout after months of lower highs.
A bullish RSI divergence suggests a possible upward movement.
A tightening 4-hour triangle pattern confines DOGE between $0.135 and $0.17 before April 18.
Dogecoin (DOGE) is currently trading within a multi-month descending wedge, simultaneously forming a short-term triangle. Analysts are closely monitoring momentum shifts and chart compression for indications of an imminent breakout in either direction.
Multi-Month Wedge Shows Structural Compression
Since November 2023, Dogecoin has formed a descending wedge on the daily timeframe, characterized by lower highs and lower lows. This structure is now compressing near $0.16. Market analyst Javon Marks analyzed this wedge and its momentum signals. He observed that DOGE has remained below resistance since its December peak, while support has held consistently.

Source: Javon Marks
Marks further examined the RSI, noting three higher lows since January 2024, contrasting with lower lows in price. This bullish divergence is often associated with breakouts in similar falling wedge patterns. He also highlighted the narrowing gap between the price and the wedge boundaries, with the current price near $0.16 just below long-term resistance, suggesting building pressure. The proximity to the wedge apex typically signals increased volatility. He observed lower tails on recent candlesticks, indicating buying interest near support, and while volume remains low, occasional upside spikes suggest underlying accumulation. Although no breakout has yet occurred, the price range continues to tighten.
Short-Term Triangle Builds Compressed Range
Trader Tardigrade analyzed Dogecoin's 4-hour chart, identifying a symmetrical triangle forming since early April. The price is compressed between $0.135 and $0.17, bounded by rising lows and a descending trendline. This pattern indicates tightening volatility and a pending significant price move.
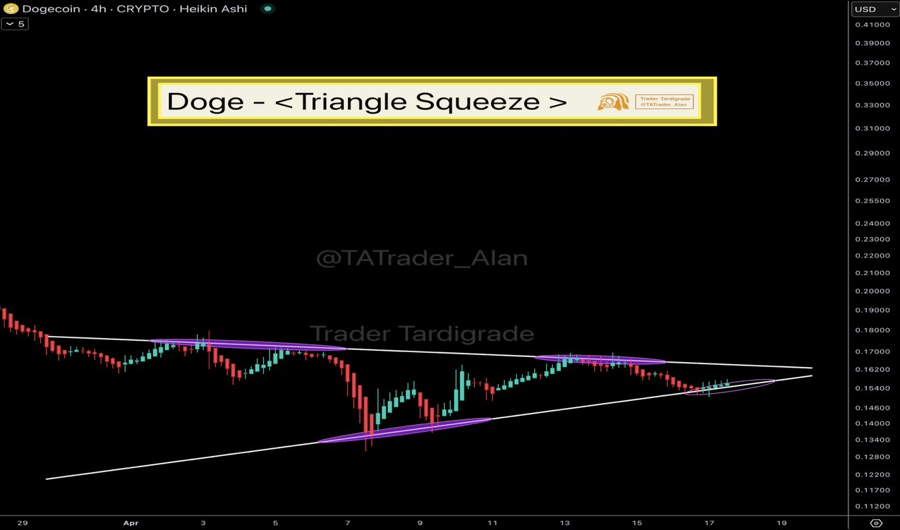
Source: Trader Tardigrade
Focusing on the triangle's apex, Tardigrade noted low-body Heikin Ashi candles near the top, reflecting indecision as the price consolidates within narrowing boundaries. Bounces on April 3, 8, and 17 confirmed the trendline's strength, and repeated rejections at resistance reinforced the triangle's symmetry. Each retest refined the pattern, increasing breakout pressure. The triangle is nearing completion, with a significant volatility expansion anticipated once the direction is established. He observed declining volume, typical of late-stage consolidation, and the approaching April 18 deadline aligns with historical patterns preceding volatility expansions. The triangle remains intact, and breakout conditions are rapidly maturing.
 Coinpaper
 Finance Feeds
 CryptoNewsLand
 Deythere
 36Crypto
 TurkishNY Radio
 Bitcoin Sistemi
 CoinoMedia
 Yellow News


