

Dogecoin's Price Action Repeats Bullish Pattern from 2024
Dogecoin (DOGE) is exhibiting a recurring three-phase price pattern that previously preceded significant price rallies in 2024. This pattern, identified by analysts, involves a support test, a failed rally, and a final dip before a substantial breakout. The current price action mirrors this setup, suggesting potential for renewed upward momentum.
The pattern centers around a long-term ascending trendline, providing support since mid-2024. This trendline connects three distinct lows from previous correction phases, highlighting consistent buying pressure during pullbacks.
Analysis from Bitcoinsensus reveals two near-identical reversal patterns within the past year. The first, beginning in August 2024, saw DOGE bottom near $0.06 (point 3), subsequently surging past $0.20—a nearly 3x increase. The second, commencing in March 2025, saw a similar bounce from the trendline, with point 3 forming around $0.12. This led to a rally exceeding $0.65. In both instances, the breakouts followed a rebound from the third low in the cycle. 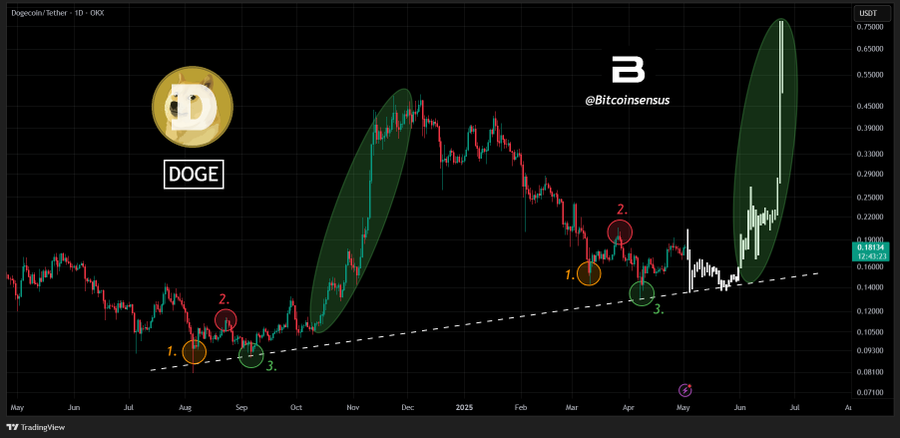
Source: Bitcoinsensus
Further corroboration comes from Trader Tardigrade's analysis, which incorporates RSI and price action from June 2024 to July 2025. This analysis focuses on accumulation zones, RSI behavior, and parabolic price movements following breakouts. Trader Tardigrade highlights accumulation around $0.06 and $0.14, characterized by rising lows and RSI crossovers above 50. These RSI shifts preceded breakouts in October 2024 and May 2025. Key pivot points, where the RSI crossed its moving average (marked in pink), coincided with significant volume increases and sharp price surges. The chart shows DOGE exceeding $1.00 in July 2025 after establishing a base near $0.14. 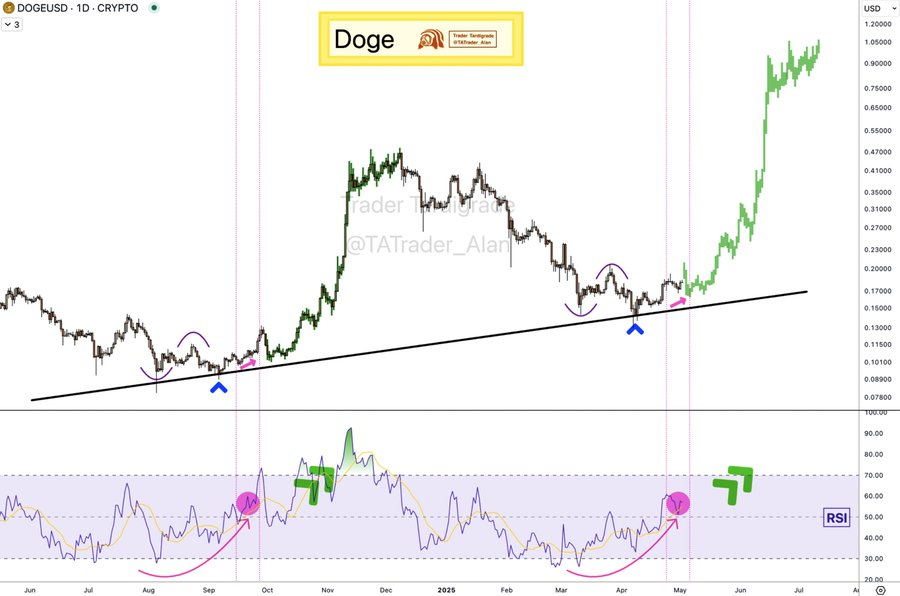
Source: Trader Tardigrade
Both analysts emphasize the significance of the structural pattern, trendline support, and RSI indicators in confirming the current bullish setup.
 Coinpaper
 Finance Feeds
 CryptoNewsLand
 Deythere
 36Crypto
 TurkishNY Radio
 Bitcoin Sistemi
 CoinoMedia
 Yellow News


