

- Dogecoin trades at $0.2241, down 3.8% in 24h, while support holds at $0.2216.
- Resistance at $0.2339 continues to restrict upside momentum despite a 1.7% gain against Bitcoin.
- RSI at 36.28 and MACD at -356.81M indicate constrained momentum with consolidation in play.
The price behavior of Dogecoin has reached a decisive phase and the traders will be keeping an eye on the behavior of Dogecoin with regards to support and resistance levels. The token is trading at the present value of $0.2241 and this represents a 3.8 percent fall over the last 24 hours. Dogecoin has a 0.052051 BTC against Bitcoin, and it has increased by 1.7% over the same sales period. The question now is whether the token has the potential to hold at close to $0.2216 or experience even more pressure as the resistance at $0.2339 puts a limit on short-term momentum.

Support and Resistance Define Short-Term Moves
The near-term focus is on support at $0.2216, which has been the key stabilizer for recent price action. Sustaining this level, the possibility for retesting resistance at $0.2339 looks likely. But failure through support might introduce further downside activity, which would make traders cautious about market positioning.
In particular, the price decline happens at the same time as rising volatility in the broader market, making these price levels that much more important. Resistance remains as a barrier, with sellers remaining firm in the upper side of the current consolidation.
Chart Structure Highlights Recurring Pattern
The long-term chart indicates repeating structures in Dogecoin’s price history. Observers note recurring phases where prolonged consolidation has preceded steep upward moves. Current monthly data highlights another period of attempted recovery following a sustained downturn.
The chart reflects similarities with earlier cycles, where resistance breakouts followed extended ranges. Whether this setup evolves into a comparable pattern remains dependent on near-term movements around the highlighted levels. Importantly, the structure emphasizes the interplay between consolidation and resistance challenges.
Dogecoin Momentum Indicators Highlight Cautious Consolidation Phase
Technical indicators are also drawing market attention. The Relative Strength Index (RSI 14) currently reads 36.28, while the upper reference line stands at 40.21. This positioning suggests momentum remains constrained within a neutral to slightly oversold range.
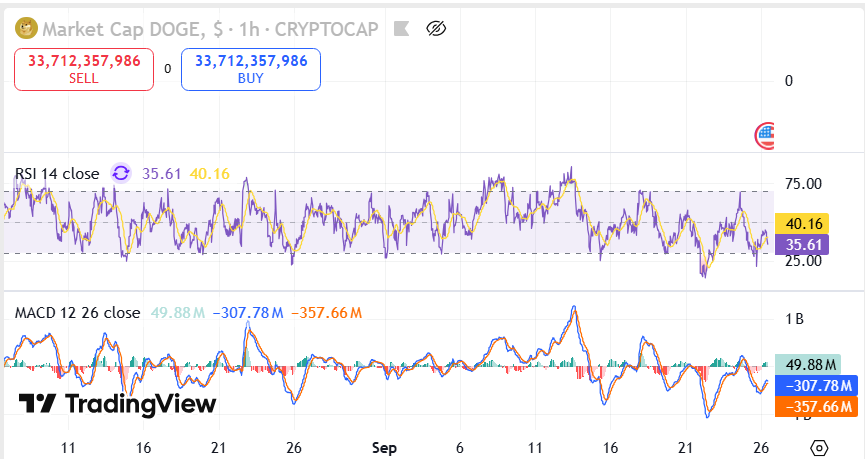
Meanwhile, the MACD values display further insight into ongoing momentum changes. The MACD line sits at 53.26M, while the signal line records -303.56M with a histogram reading of -356.81M. These levels reflect uneven momentum, aligning with the recent dip in price and continued sideways movement.
Put collectively, these readings highlight the significance of the existing support and resistance rates. As the price remains in the range of $0.2216 to $0.2339, traders are keen on any future changes in direction, which may affect the future sessions of Dogecoin.
 Crypto Front News
 Coindoo
 CoinCryptoNews
 Coinlive.me
 Crypto Economy
 Coindoo.com
 Cointelegraph
 Crypto News Land
 BlockchainReporter


