

Bitcoin (BTC) bulls attempted to push the price above $85,000, but were ultimately met with resistance from bears. On a positive note, larger investors appear to be accumulating at lower price points. Santiment, a research firm, reported on X that wallets holding 10 BTC or more have acquired approximately 5,000 Bitcoin since March 3rd. They suggest that continued buying by large players could lead to a stronger second half of March compared to recent performance.
However, not all analysts share this bullish near-term outlook. Arthur Hayes, BitMEX co-founder and Maelstrom CIO, posted on X that Bitcoin could retest $78,000, potentially even falling below $75,000. He warned of potentially volatile price action should the price drop within the $70,000 to $75,000 range, due to significant open interest concentrated there.
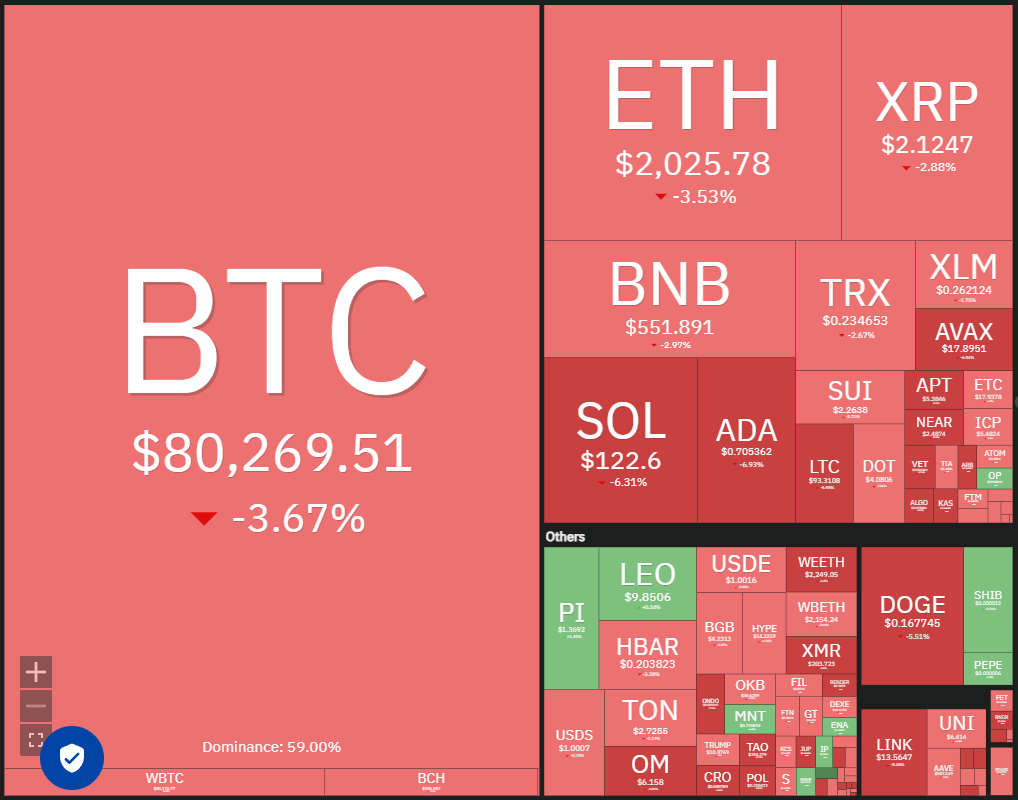
Short-term investor sentiment remains bearish. CoinShares data reveals $876 million in outflows from cryptocurrency exchange-traded products (ETPs) last week, bringing the four-week total to $4.75 billion. Bitcoin ETPs accounted for the majority of these outflows, at $756 million.
Can Bitcoin initiate a recovery from current levels, subsequently lifting altcoins? Let's analyze the charts.
S&P 500 Index Price Analysis
The S&P 500 Index (SPX) reversed course from its 20-day exponential moving average (5,900) on March 3rd and broke below the 5,773 support level on March 6th, completing a double-top pattern.
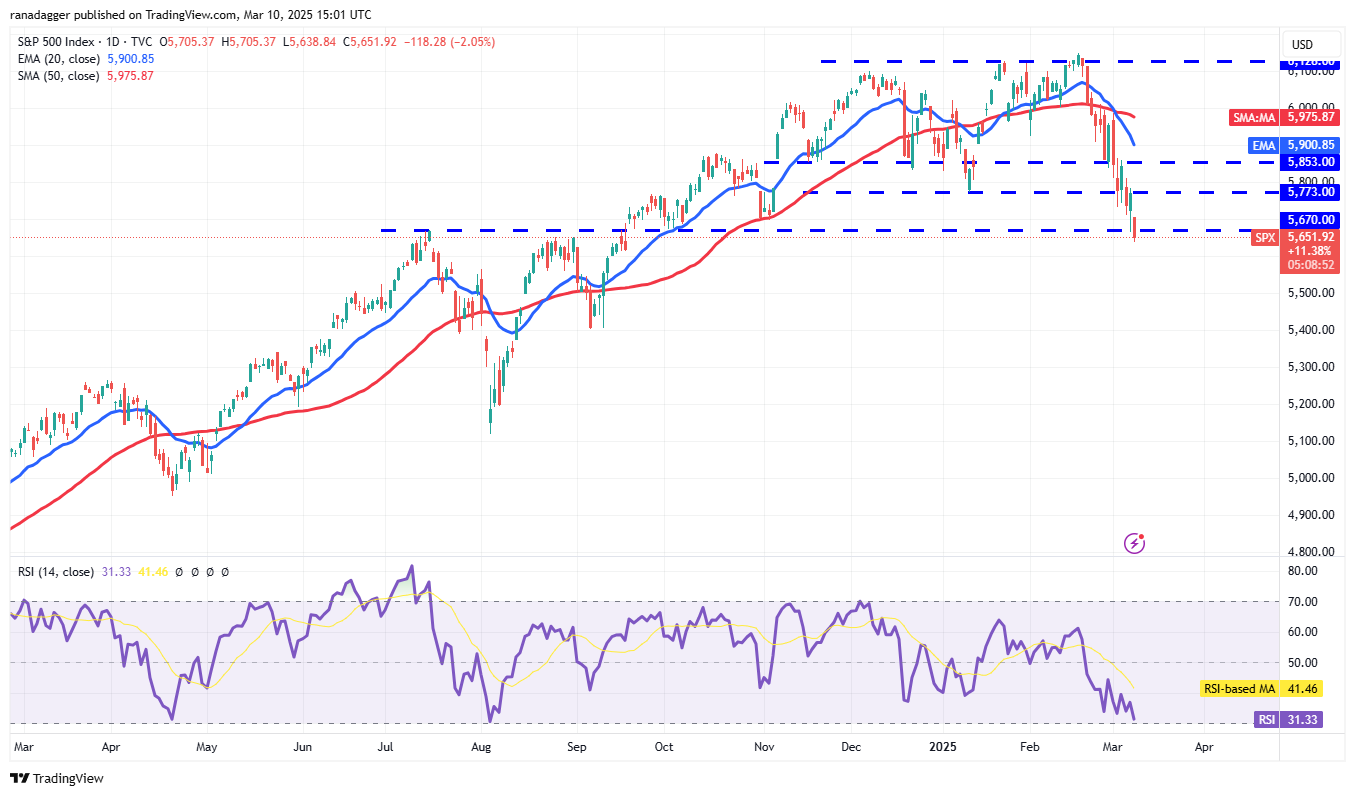
The index rebounded from 5,670 on March 7th, but bears successfully defended the 5,773 breakdown level. A subsequent decline broke below the 5,670 support on March 10th, paving the way for a potential drop to 5,400. Sustained price action above 5,773 would signal robust demand, potentially leading to a rise towards the 20-day EMA, which is anticipated to provide strong resistance.
US Dollar Index Price Analysis
The US Dollar Index (DXY) experienced a sharp decline starting March 3rd, breaking below the 105.42 support on March 5th.
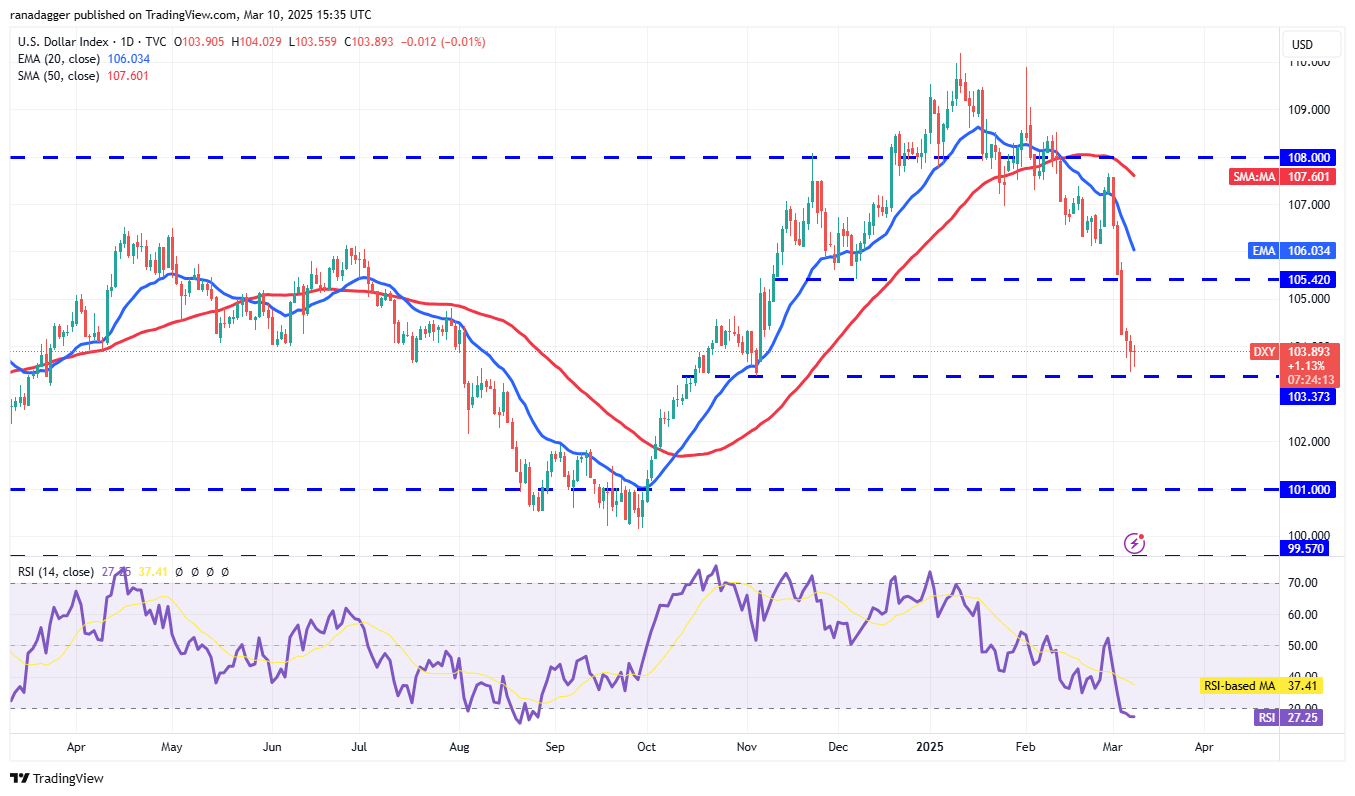
This break below 105.42 suggests the prior breakout above 108 may have been a bull trap. While buyers are attempting to defend the 103.73 level, any relief rally is expected to encounter selling pressure at the 20-day EMA (106.03). A reversal from the current level or the 20-day EMA would indicate negative sentiment, increasing the risk of a break below 103.37 and a potential plunge to 101. Sustained price action above the 20-day EMA would be needed to pave the way for a rally to 108.
Bitcoin Price Analysis
BTC broke below the symmetrical triangle pattern's support line on March 9th, signaling seller dominance.
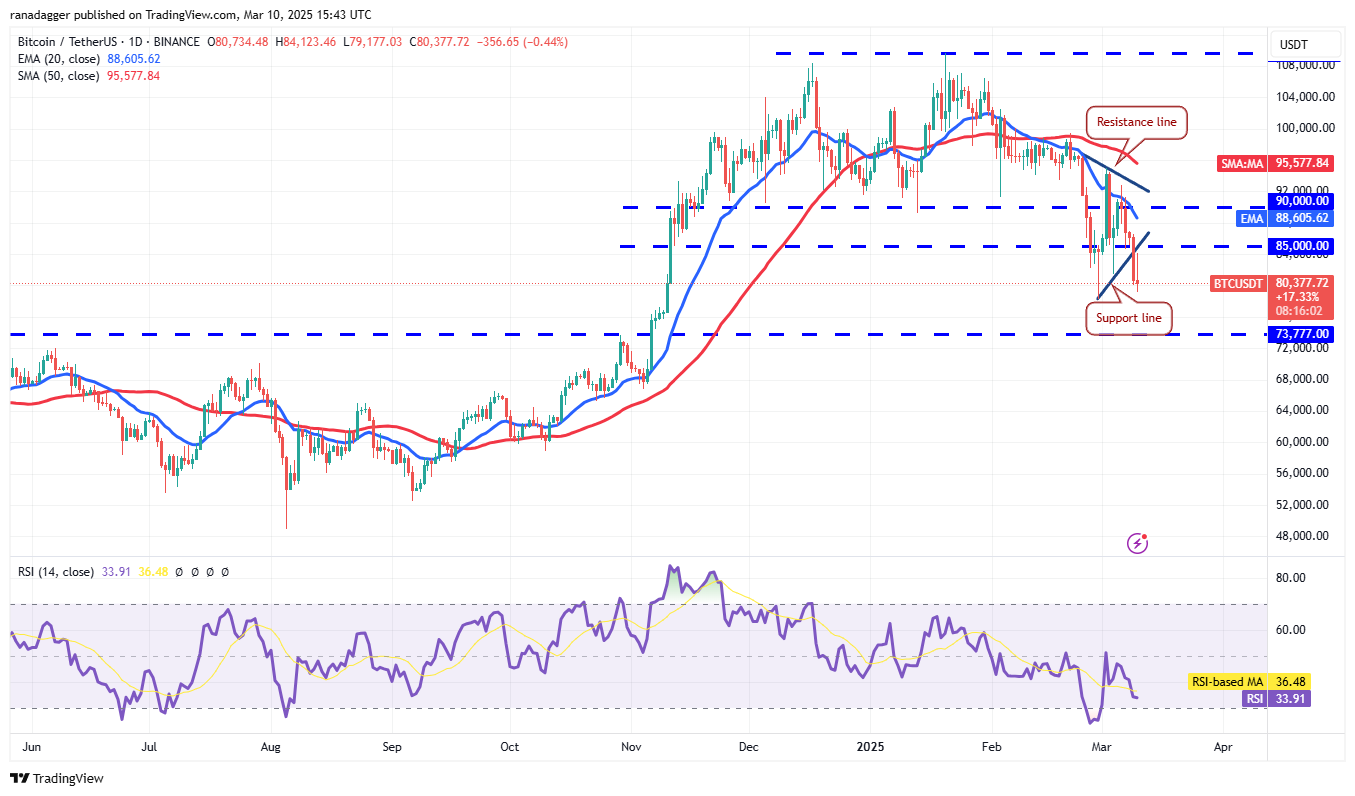
Bulls are attempting to defend the $81,500 to $78,258 support zone, but a recovery attempt faced selling pressure at the breakdown level on March 10th. This suggests bears are attempting to transform the support line into resistance. A break below $78,258 could lead to a decline to $73,777. Conversely, a successful defense of the support zone and a move above the 20-day EMA ($88,605) could lead to a rally towards the resistance line.
Ether Price Analysis
Ether (ETH) closed below the crucial $2,111 support on March 9th, signaling a continuation of the downtrend.
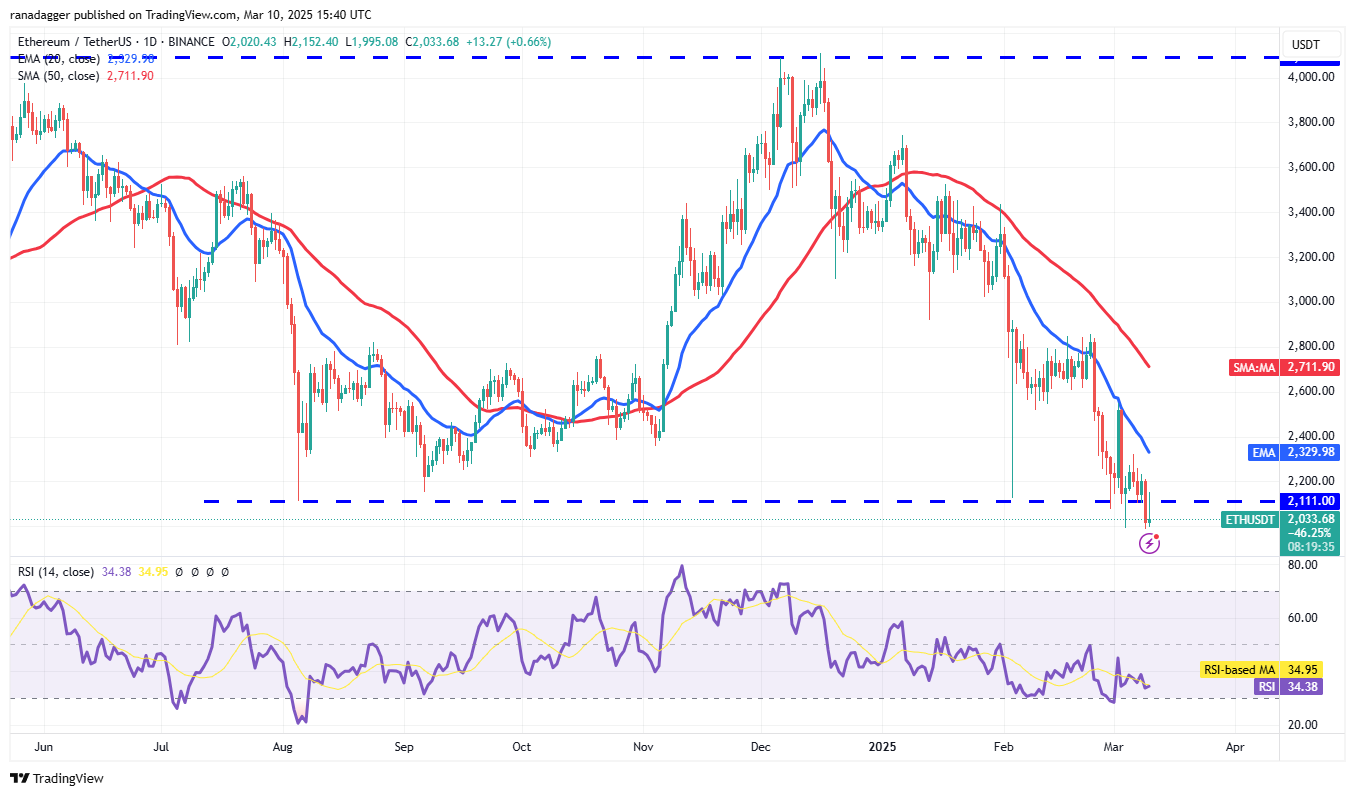
While buyers attempted to push the price above $2,111 on March 10th, a long candlestick wick indicates strong selling pressure. Minor support exists at $1,993, but a break below this level could lead to a decline to $1,750 and potentially $1,550. Sustained price action above the 20-day EMA ($2,329) would be needed to suggest the break below $2,111 was a bear trap, potentially leading to a rally towards the 50-day SMA ($2,711).
XRP Price Analysis
XRP (XRP) continues its decline towards the crucial $2 support, indicating potential bear market control.
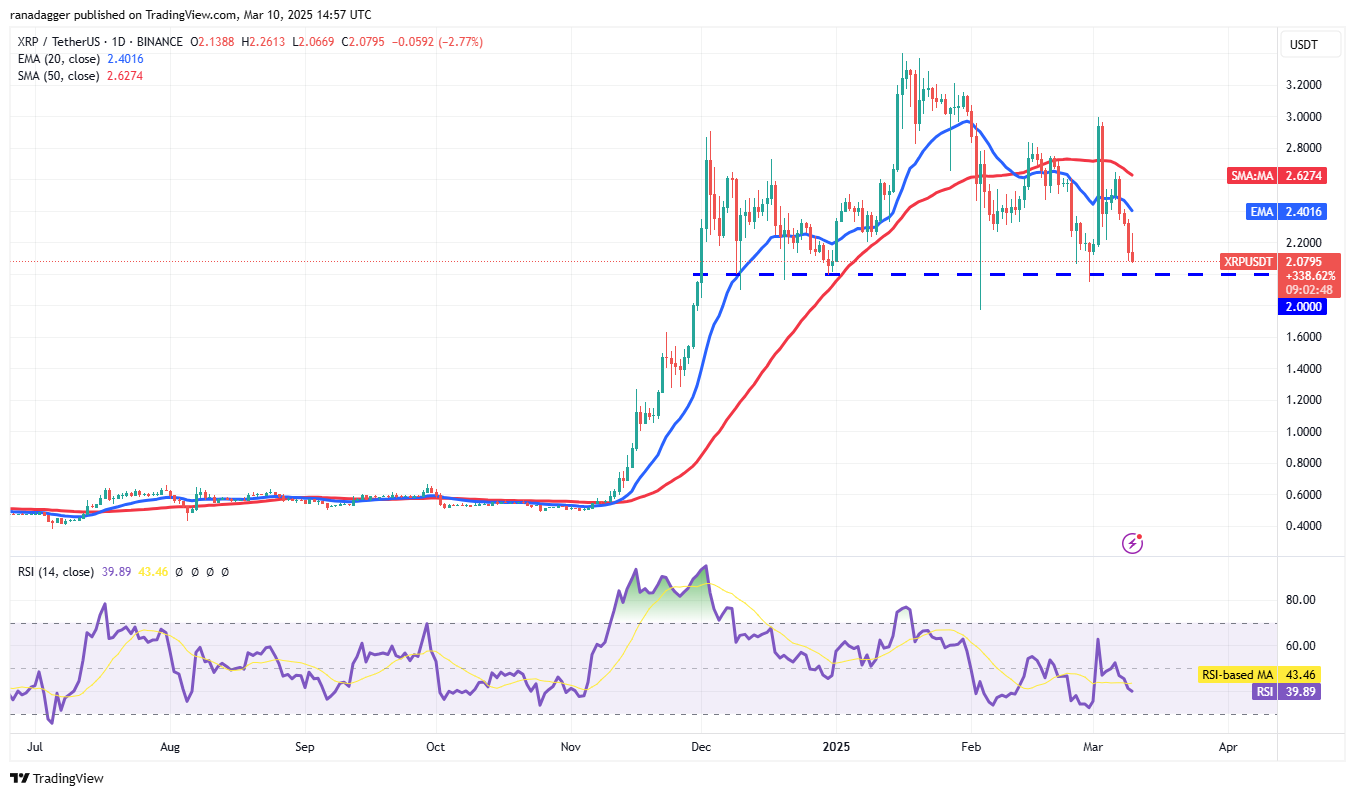
A break and close below $2 would complete a bearish head-and-shoulders pattern. While minor support exists at $1.77, a break below this level could lead to a decline towards $1.28. Conversely, a strong bounce off $2 would signal strong buyer support. The 20-day EMA ($2.40) is likely to act as resistance, but a break above could lead to a rise to $2.80.
BNB Price Analysis
BNB's (BNB) failure to surpass the 20-day EMA ($601) triggered further selling on March 9th, pushing the price below $546.
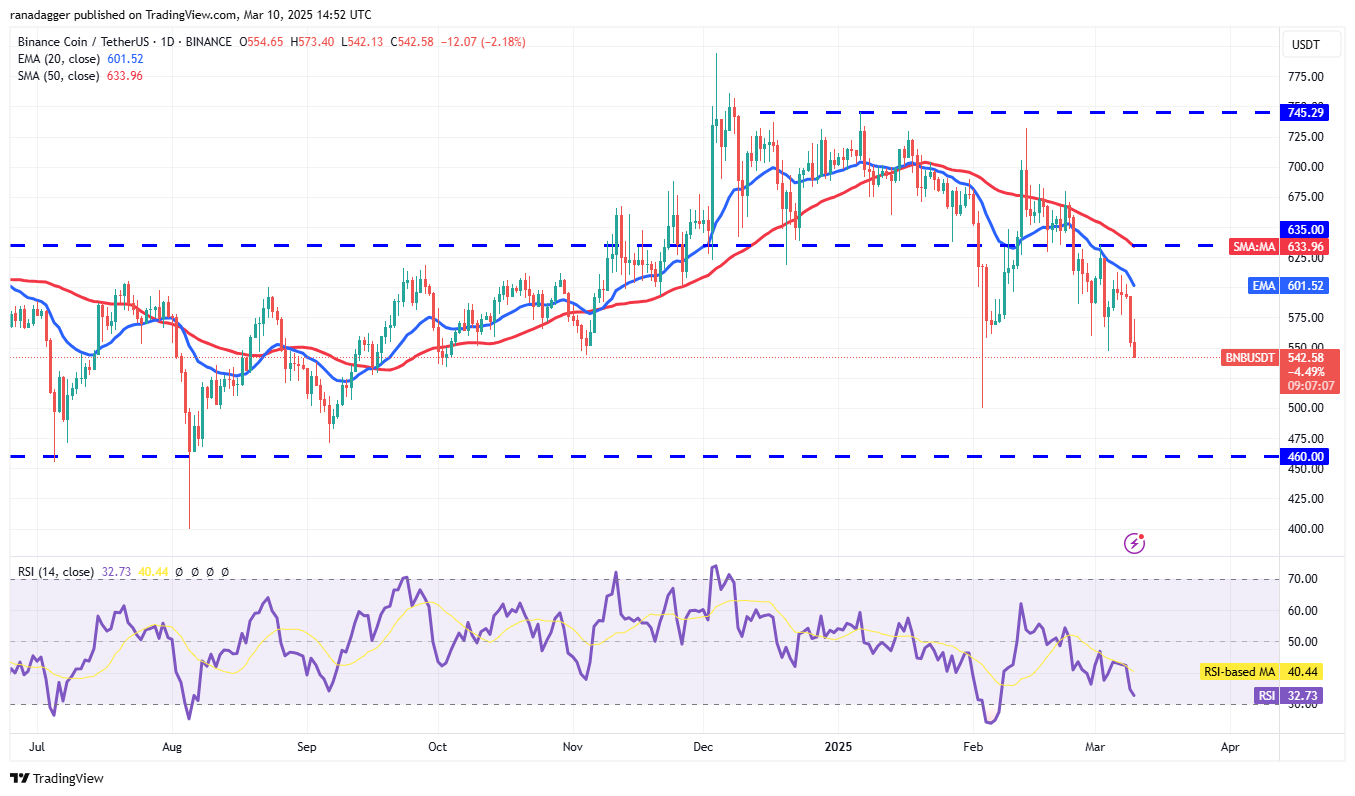
Downward-sloping moving averages and a relative strength index (RSI) in negative territory suggest a bearish trend. Sustained price action below $546 could lead to a decline to $500, with buyers expected to defend the $500-$460 zone. A break above the 20-day EMA would be needed to initiate a potential rise towards the 50-day SMA ($633), a close above which would signal a short-term trend reversal.
Solana Price Analysis
Solana (SOL) broke below its uptrend line on March 9th, reaching the strong support zone between $120 and $110.
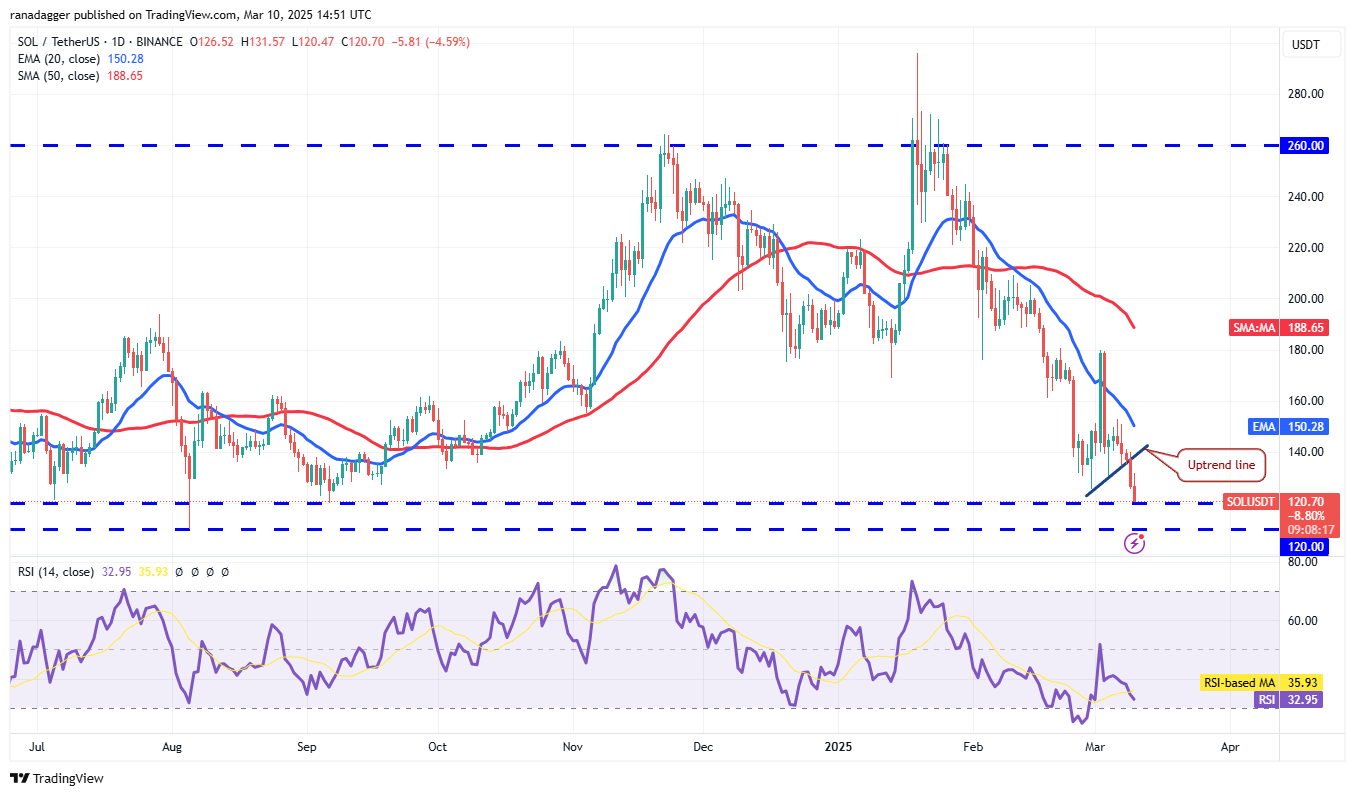
While bulls are expected to defend this support zone, any relief rally could encounter selling pressure at the 20-day EMA ($150). A sharp decline from the 20-day EMA could risk a break below $110, leading to a potential decline to $100 and further to $80. Conversely, a rise above the 20-day EMA would signal strong buying, potentially leading to a climb towards the 50-day SMA ($188).
Dogecoin Price Analysis
Dogecoin (DOGE) fell below the $0.18 support on March 9th, indicating a resumption of the downtrend.
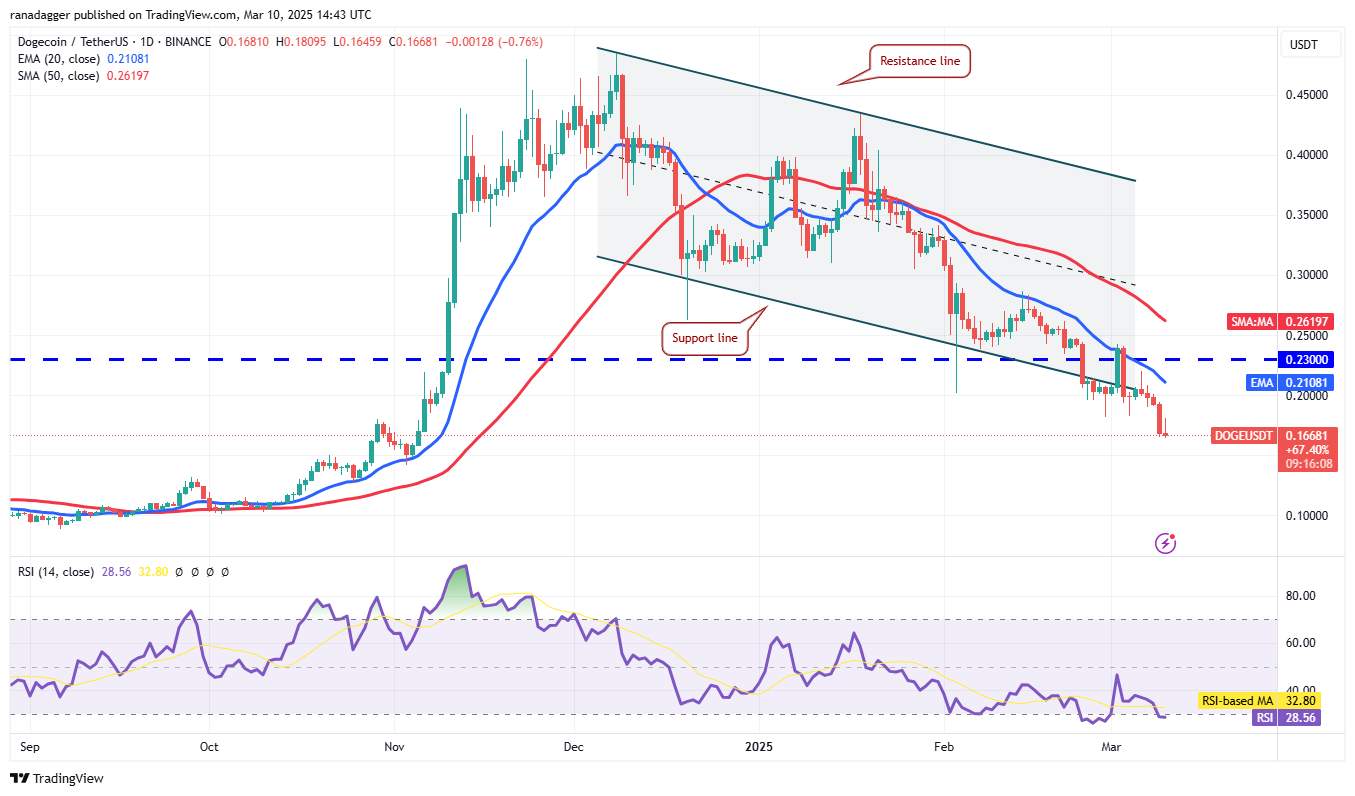
Downward-sloping moving averages and an RSI in oversold territory suggest bear market dominance. The 20-day EMA ($0.21) is a key resistance level. A sharp decline from this EMA could lead to a drop to $0.14. A break and close above the 20-day EMA would signal easing selling pressure, potentially leading to a rise towards the 50-day SMA ($0.26), which could also act as resistance.
Cardano Price Analysis
Cardano (ADA) fell below its moving averages on March 8th, indicating strong selling pressure.
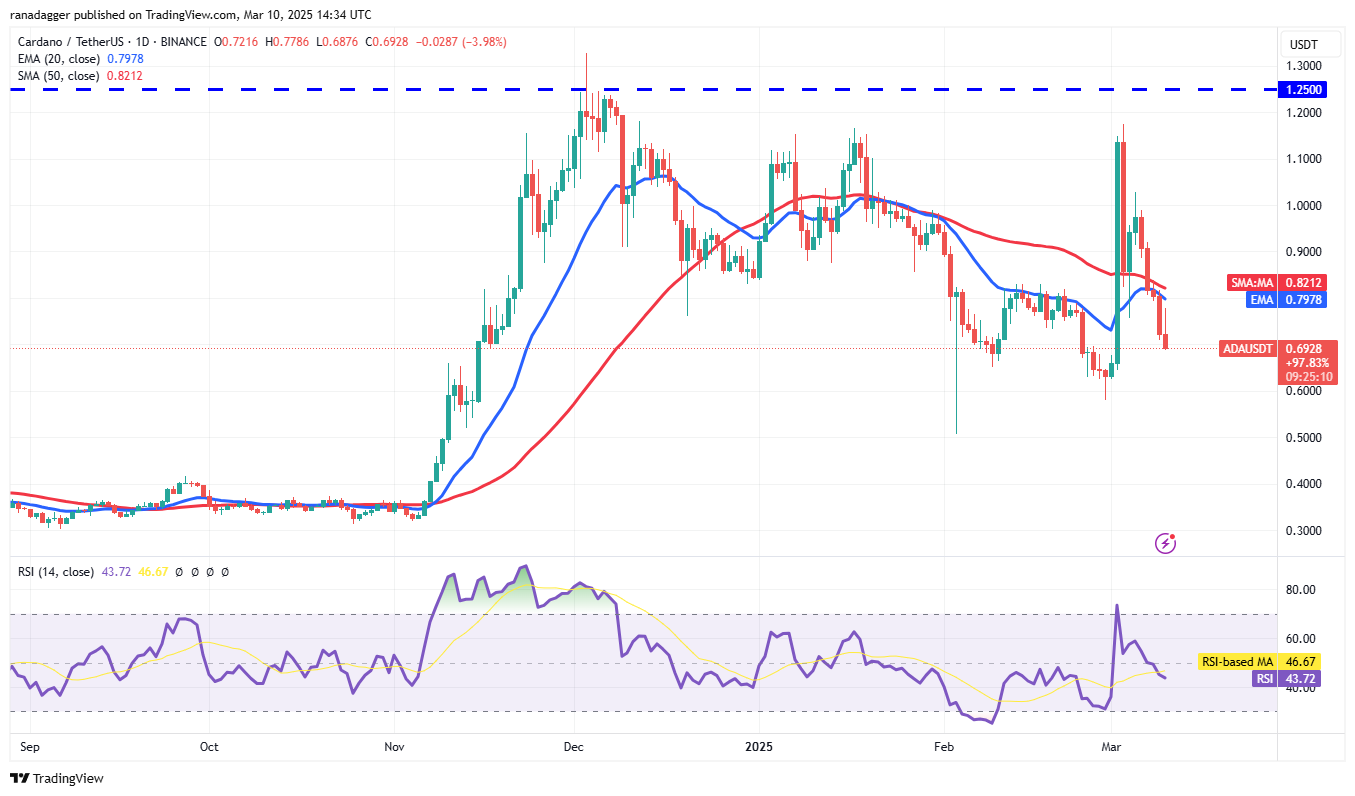
Downward-sloping moving averages and an RSI in negative territory suggest a slight bearish edge. Support levels exist at $0.58 and $0.50. Any relief rally is likely to face selling pressure at the moving averages. Sustained price action above the moving averages would be needed to signal a potential recovery, potentially leading to a rise towards $1.02.
Pi Price Analysis
Pi (PI) fell to the 61.8% Fibonacci retracement level of $1.20 on March 9th, indicating continued bear pressure.
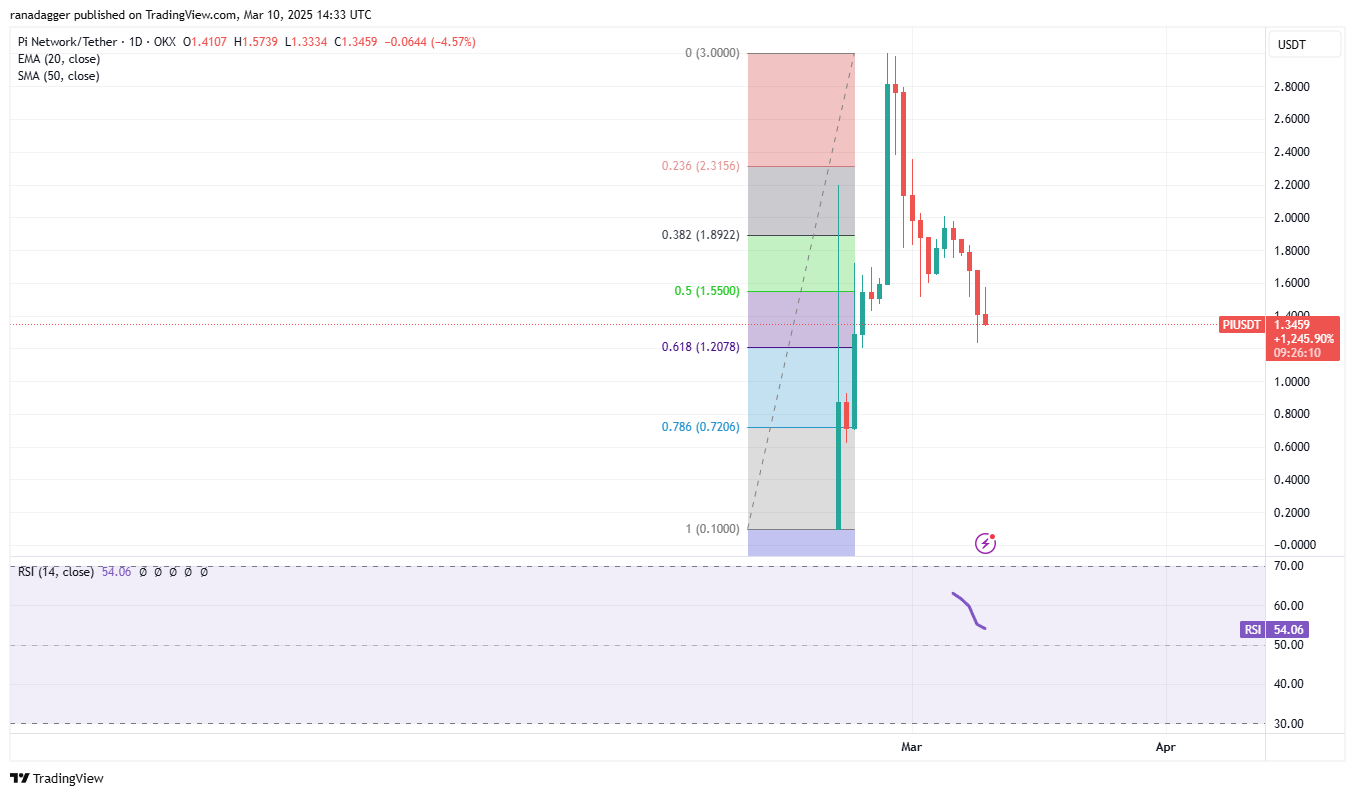
Buyers are attempting a recovery, but a long wick on the March 10th candlestick shows selling at higher levels. This increases the risk of a break below $1.20, potentially leading to a decline to the 78.6% retracement level of $0.72. To prevent further downside, bulls need to quickly push the price above the $2 resistance level, which would suggest the correction may be over.
Disclaimer: This article does not provide investment advice or recommendations. All investment and trading decisions involve risk, and readers should conduct their own thorough research before making any decisions.
 U.Today
 CoinDesk
 CoinDesk
 CoinDesk
 Cryptopolitan
 https://www.facebook.com/Coinpedia.org
 https://www.facebook.com/Coinpedia.org


