

Global trade tensions between the United States and China continue to fuel volatility in risky assets, keeping investors cautious. Bitcoin (BTC), however, has shown resilience, trading comfortably above the crucial near-term support level of $73,777.
BitMEX co-founder Arthur Hayes suggested on X that a weakening of the yuan by the People’s Bank of China (PBOC) could trigger the next crypto bull run. Similar situations in 2013 and 2015 saw significant capital flight from China into Bitcoin, and he believes a repeat is possible in 2025.
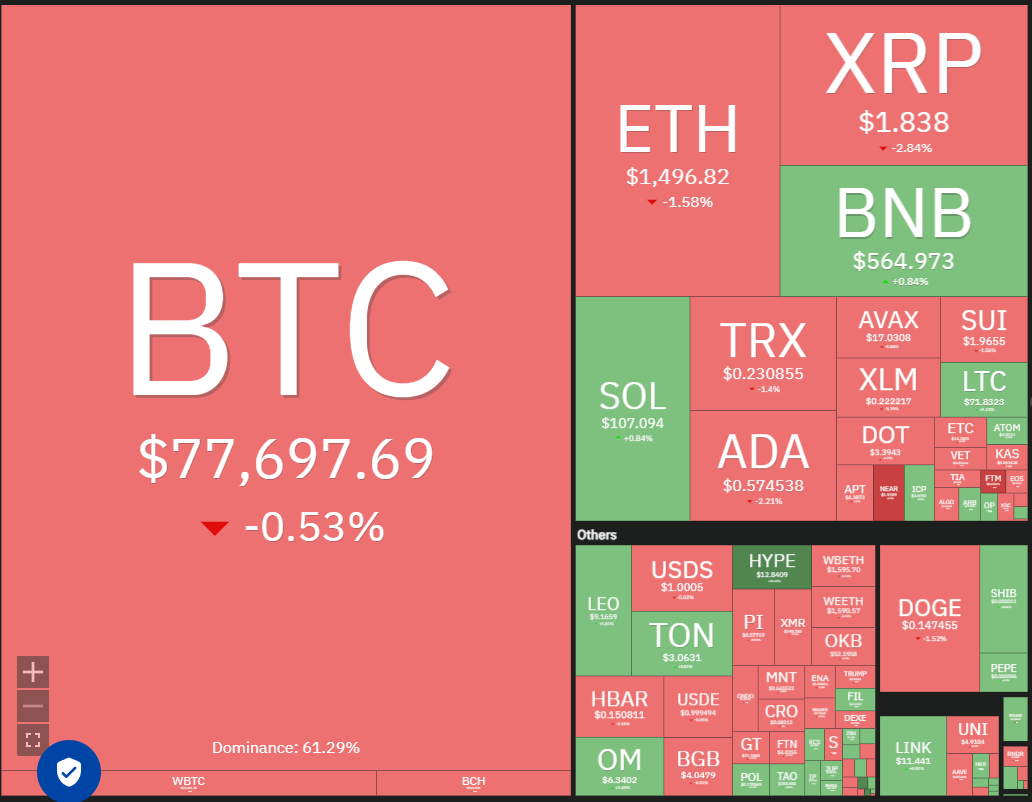
The current market situation remains unpredictable. Investor risk aversion is evident in the $595.9 million outflow from US-listed spot Bitcoin exchange-traded funds over the past four trading days, according to Farside Investors data.
Will Bitcoin maintain its position above the $73,777 support, or will bearish pressure prevail? What about altcoins? Let's analyze the charts of the top 10 cryptocurrencies to gain some insight.
Bitcoin Price Analysis
Bitcoin attempted a recovery on April 8th, but encountered strong selling near the 20-day exponential moving average ($82,218). This indicates negative sentiment and a tendency for traders to sell on rallies.
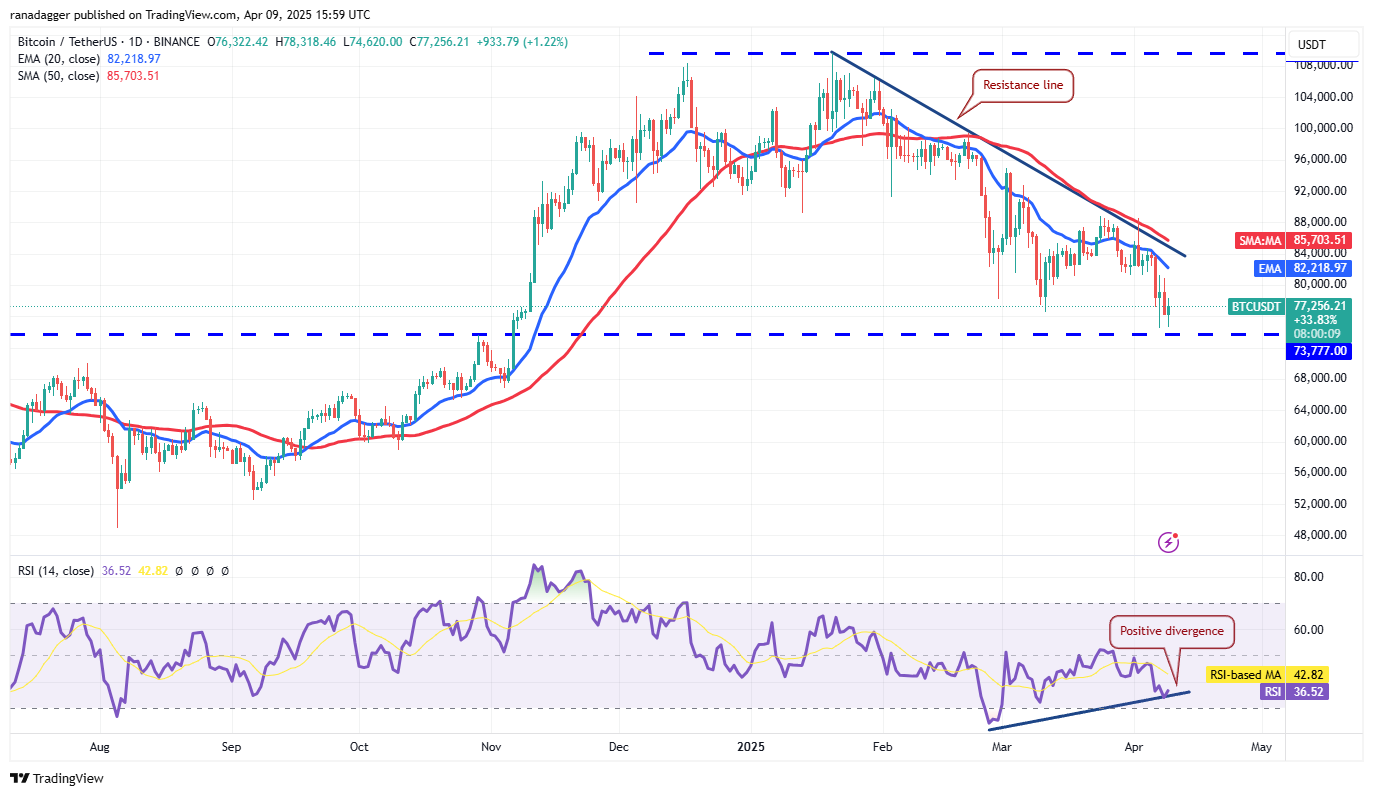
Downsloping moving averages favor the bears, yet a positive divergence in the relative strength index (RSI) suggests slowing bearish momentum. However, a breach of the $73,777 support could lead to a swift decline to the next support level at $67,000. Significant buying is anticipated within the $67,000 to $65,000 support zone. The 50-day simple moving average ($85,703) represents key overhead resistance. A sustained price move above this SMA would signal a potential end to the corrective phase. Until then, rallies are likely to be met with selling pressure.
Ether Price Analysis
Ether (ETH) has experienced a significant downtrend, but has found support at $1,368, potentially initiating a relief rally.

The ETH/USDT pair could rise to the 20-day EMA ($1,786), which is likely to provide strong resistance. A reversal from the 20-day EMA could see the bears push the price below $1,368, potentially leading to a drop to $1,150. Conversely, a rebound from $1,368 after a decline from the 20-day EMA would suggest a near-term range-bound pattern. A decisive break and close above the 20-day EMA would signal weakening bearish pressure, potentially leading to a rise towards the previous breakdown level of $2,111.
XRP Price Analysis
XRP (XRP) attempted to break above the $2 level on April 8th, but bearish pressure prevailed, suggesting a potential resistance level.

A break below $1.61 could resume the downtrend, with the next support at $1.27. Conversely, a price move above the 20-day EMA ($2.10) would indicate strong demand. While the 50-day SMA presents minor resistance, a break above it could lead to a rally towards the resistance line, where further selling pressure is anticipated.
BNB Price Analysis
BNB (BNB) is attempting to form a higher low at $520, suggesting strong buying at lower levels.
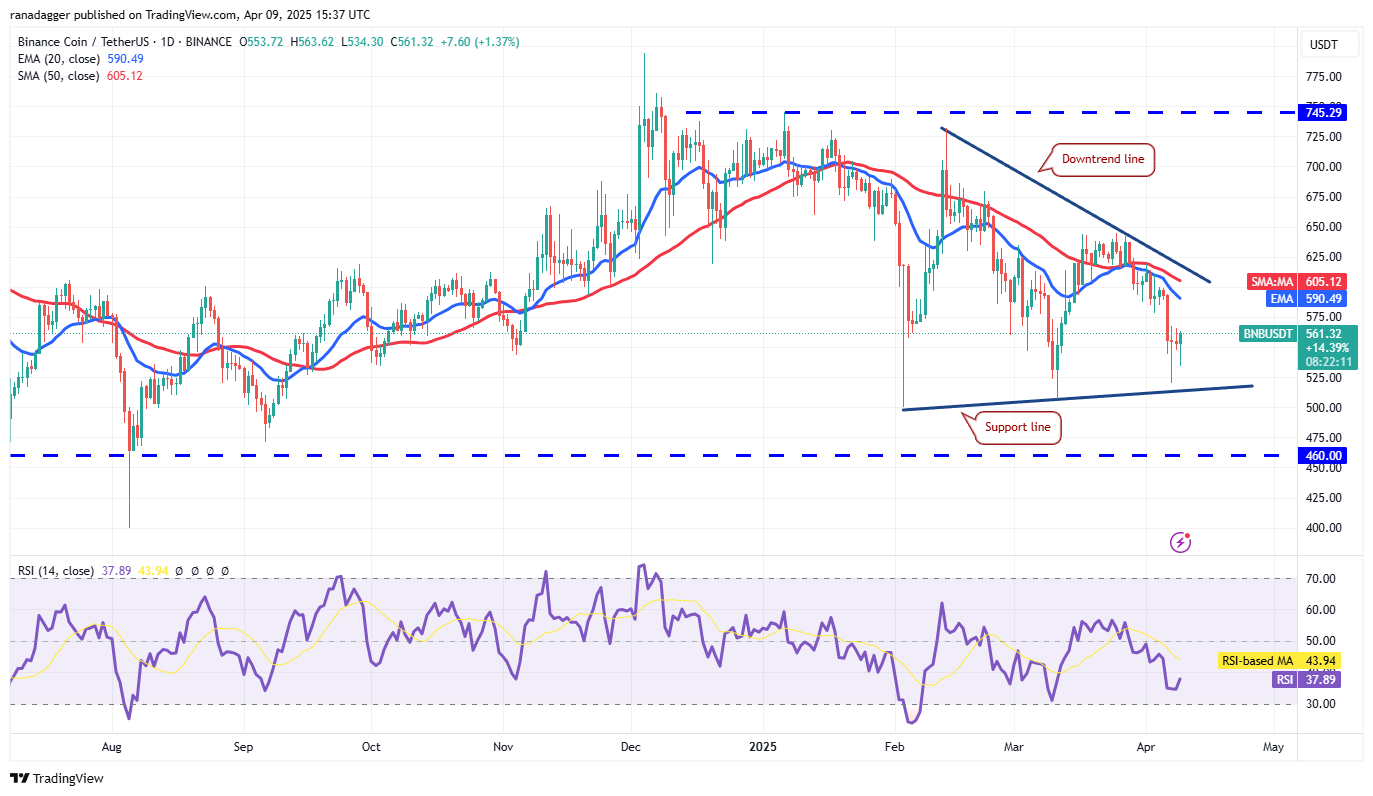
Bulls will aim to push the price towards the downtrend line, which is expected to act as significant resistance. A reversal from the downtrend line indicates continued bearish pressure, potentially leading to range-bound trading within a triangle pattern. The support line is crucial; a break below it could trigger a drop to $460, with further potential decline to $400 if that support fails.
Solana Price Analysis
Solana (SOL) has traded below the $110 support level, yet the absence of aggressive selling suggests a lack of bearish momentum.

Buyers are expected to encounter resistance in the $110 to $120 range. A reversal from this range would indicate continued selling pressure, increasing the risk of a break below $95 and a potential drop to $80. Conversely, a break and close above $120 would signal rejection of the breakdown below $110. The 50-day SMA ($135) may act as resistance, but a break above it could lead to a rally to $147 and potentially $180.
Dogecoin Price Analysis
Dogecoin (DOGE) is experiencing a struggle between bulls and bears near the $0.14 support level.
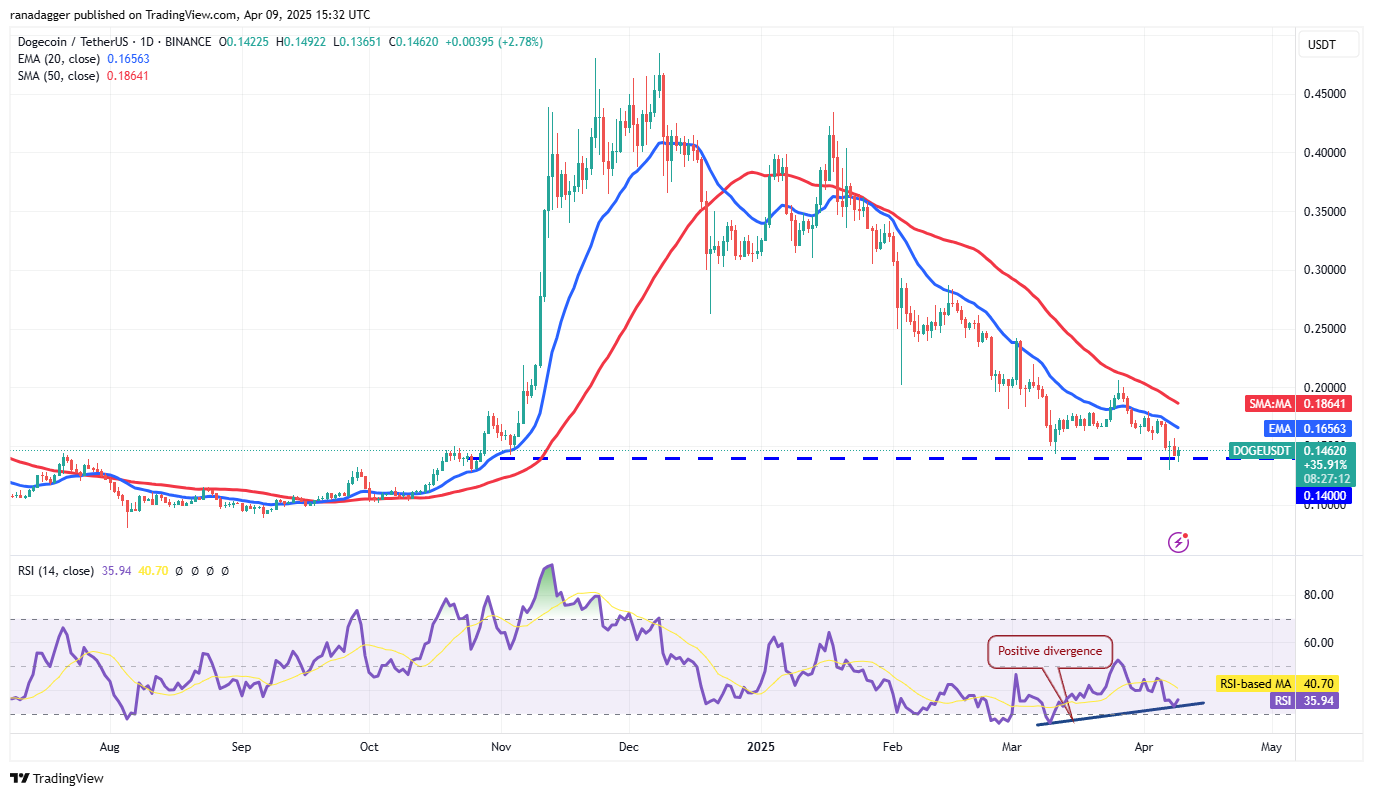
Downsloping moving averages favor the bears, but a positive divergence in the RSI indicates diminishing selling pressure. However, a sustained break below $0.14 could accelerate selling, leading to a drop to $0.10. Conversely, a break and close above the $0.20 resistance would signal a double bottom pattern, potentially leading to a rally to $0.24 and further to a target of $0.26.
Cardano Price Analysis
Buyers are attempting to keep Cardano (ADA) above the $0.50 support level, but are likely to face selling pressure on any rallies.
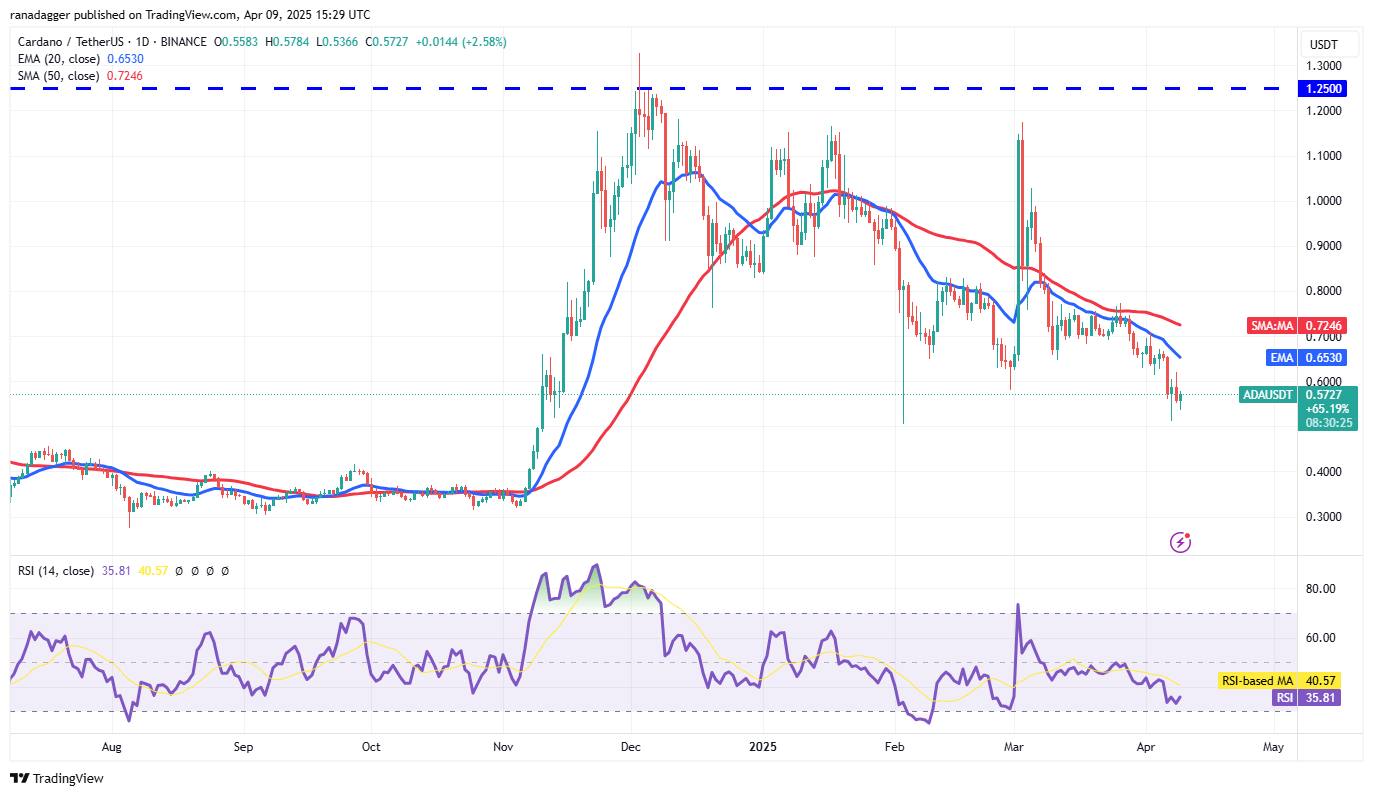
A reversal from the 20-day EMA ($0.65) increases the risk of a break below $0.50, potentially leading to a drop to $0.45 and then $0.40. The $0.30 to $0.40 support zone is expected to see strong buying. A break and close above the 20-day EMA would signal strength, potentially leading to a rise towards the 50-day SMA ($0.72). A break above this SMA would suggest a short-term trend reversal.
UNUS SED LEO Price Analysis
UNUS SED LEO (LEO) has initiated a recovery, but is expected to encounter selling pressure at the 20-day EMA ($9.36).
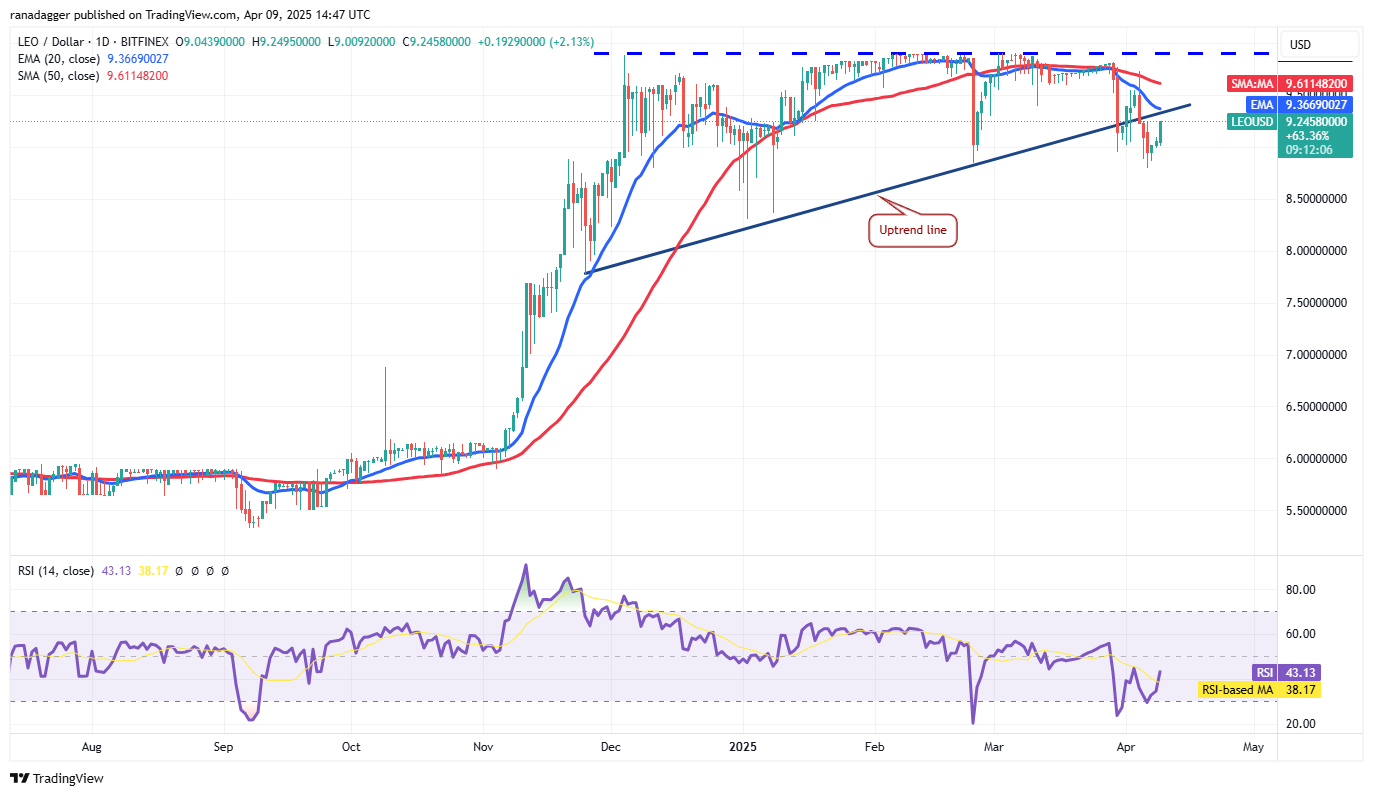
A reversal from the 20-day EMA would suggest negative sentiment and selling on rallies, increasing the risk of a break below the $8.80 support, potentially leading to a drop to $8.30. Conversely, a sustained price above the 20-day EMA indicates strong buying, potentially leading to a rise towards the $9.90 resistance level.
Chainlink Price Analysis
Chainlink (LINK) has fallen to the support line of a descending channel pattern, where buying is expected.

Any rebound from the support line is likely to face selling pressure at the moving averages. A sharp reversal from the moving averages could break below the support line, with the next support at $8. Buyers need to push and maintain the price above the 50-day SMA ($14.50) to weaken bearish momentum, potentially leading to a rise towards the resistance line.
Toncoin Price Analysis
Toncoin (TON) is finding support at $2.84, but the lack of a strong rebound suggests weak buying interest.

The downsloping 20-day EMA ($3.41) and negative RSI indicate bearish dominance. A break below $2.84 could lead to a drop to $2.35. To prevent further decline, buyers need to push and maintain the price above the moving averages, potentially leading to a rally to $4.14, where strong resistance is anticipated.
Disclaimer: This article does not provide financial advice. All investment and trading decisions involve risk, and readers should conduct thorough research before making any decisions.
 Coinpaper
 Finance Feeds
 CryptoNewsLand
 Deythere
 36Crypto
 TurkishNY Radio
 Bitcoin Sistemi
 CoinoMedia
 Yellow News


