

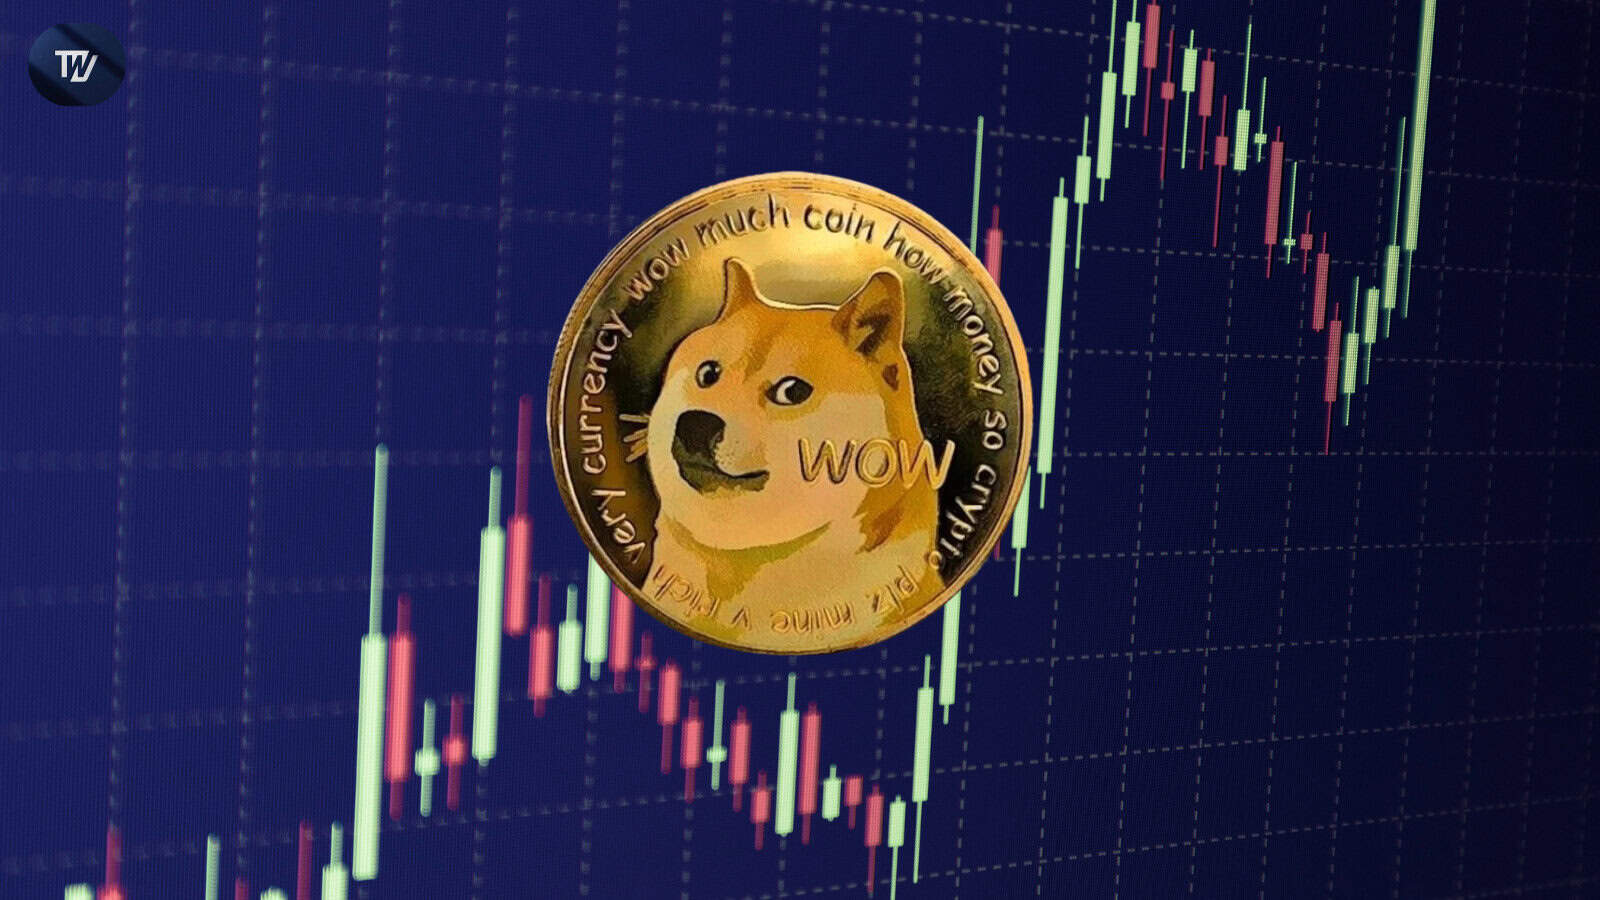
Dogecoin (DOGE) price appears poised for a significant upward move, according to analysts tracking its repeating price patterns and momentum indicators. Current technical setups hint that DOGE could revisit the $1 milestone, driven by recent Relative Strength Index (RSI) positioning, fractal symmetry, and key moving averages.
據分析師稱,Dogecoin(Doge)的價格似乎有望進行重大的向上移動。當前的技術設置暗示,Doge可以重新審視1美元的里程碑,這是由於最近的相對強度指數(RSI)定位,分形對稱性和關鍵移動平均值所驅動的。
The 3-day RSI for Dogecoin has recently returned to the 50 level, a threshold it reached before previous price rallies. Analyst Trader Tardigrade highlighted that past DOGE rallies consistently occurred when the RSI remained within the mid-range. This recurring pattern has been observed across many months, showcasing its potential for signaling upcoming trends.
Dogecoin的為期3天的RSI最近恢復了50級,這是在以前的價格集會之前達到的一個門檻。分析師Trader Tardigrade強調,當RSI留在中距離內時,過去的Doge集會一直在發生。在數月內已經觀察到了這種經常性模式,展示了其信號傳達趨勢的潛力。
However, RSI positioning at 50 usually signals the middle of a trend, suggesting neither strong buying nor selling pressure. This aligns with Dogecoin's price movements, as it hovers in a limited range, hinting at a broader market uncertainty that could favor the continuation of the current trend.
但是,在50處的RSI定位通常標誌著趨勢的中間,表明既不強勁的購買也不出售壓力。這與Dogecoin的價格變動保持一致,因為它徘徊在有限的範圍內,暗示了更廣泛的市場不確定性,這可能有利於當前趨勢的延續。
Monitoring Breakouts for Dogecoin’s Next Move
監視Dogecoin下一步的突破
Over the last two months, Dogecoin has consistently found support near the $0.185 level, with a recent noticeable bounce from this floor. Nonetheless, the 50-day moving average (MA 50) is acting as resistance, capping price gains. Analyst Jonathan Carter noted that a decisive move above MA 50 could shift the trend positively.
在過去的兩個月中,Dogecoin一直在$ 0.185的水平上找到支撐,最近從這個樓層進行了明顯的反彈。儘管如此,50天的移動平均線(MA 50)充當電阻,價格上漲。分析師喬納森·卡特(Jonathan Carter)指出,超過MA 50的決定性舉動可以積極改變趨勢。
If DOGE breaks above the 50-day moving average, several targets come into play at $0.21, $0.25, $0.31, $0.36, and $0.45. These targets align with historical resistance zones and volume clusters seen on the daily charts. A sustained move past $0.25 could open a path toward $0.45, and eventually refocus attention on the $1 level.
如果Doge突破了50天的移動平均線,則幾個目標的發揮作用為0.21美元,0.25美元,0.31美元,0.36美元和0.45美元。這些目標與每日圖表上看到的歷史阻力區和體積簇保持一致。超過0.25美元的持續搬遷可能打開了$ 0.45的道路,最終將注意力重新集中在1美元的水平上。
This technical analysis aligns with a recent analysis that highlighted Dogecoin exiting Base 3 of a parabolic structure, with the next target being Base 4 above $1.
該技術分析與最近的分析一致,該分析強調了dogecoin離開拋物線結構的基部3,下一個目標是4美元以上的基礎4。
Key liquidity levels were also mentioned around $0.187, and targets were pointed out between $0.313 and $0.3597. A breakout past these levels could trigger further momentum toward $0.40 and beyond.
還提到了大約0.187美元的主要流動性水平,目標在0.313美元至0.3597美元之間。超越這些水平的突破可能會觸發$ 0.40及以後的進一步勢頭。
The Dogecoin price is still close to $0.19, which indicates that there is a status in the market as it is locked within a tight band from $0.18 to $0.19. The coin is a bit above the 100-day exponential moving average (EMA) which indicates a slow pace of a trend and the process to make the gains permanent.
Dogecoin的價格仍接近0.19美元,這表明市場狀況在一個緊密的樂隊內,從0.18美元到0.19美元。硬幣高於100天的指數移動平均值(EMA),這表明趨勢的緩慢和使得收益永久性的過程。
By moving sideways, the market situation is telling us there is either accumulation or no clear trend yet.
通過橫向移動,市場狀況告訴我們,累積或尚無明確的趨勢。
Without a breakout or surge in volume, DOGE’s current holding pattern could continue, with mild downside risks in the short term. Traders should monitor for a decisive break above the 50 EMA or a breakdown below $0.18 to confirm the next directional move amid broader crypto market uncertainty.
如果沒有突破或數量激增,Doge的當前保持模式可能會持續下去,並且在短期內有輕微的下行風險。交易者應監視高於50 EMA的決定性突破或低於$ 0.18的故障,以確認在更廣泛的加密市場不確定性的情況下進行下一個定向行動。
 Analytics Insight: Latest AI, Crypto, Tech News & Analysis
 https://www.facebook.com/TechBullion/
 Insights
 https://web.facebook.com/Coinfomania/
 https://www.facebook.com/newsbtc


