

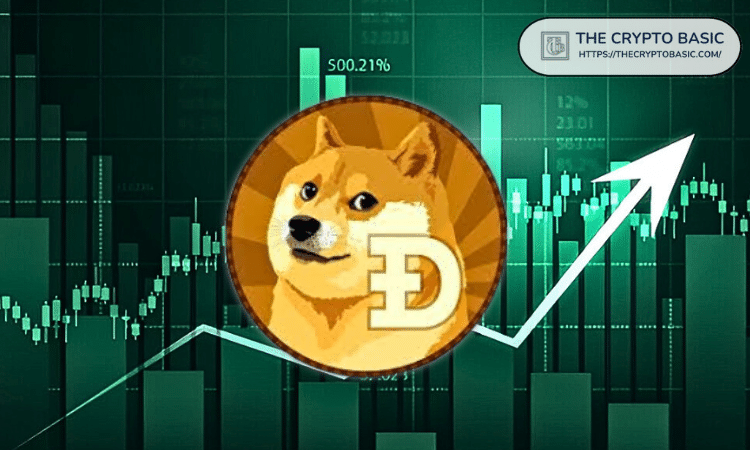
Dogecoin (DOGE) has been consolidating above the crucial support at $0.145, a level that has prevented the price from dropping further.
Dogecoin(Doge)は、価格がさらに低下することを妨げているレベルである0.145ドルで重要なサポートを超えて統合されています。
Dogecoin Price Movement: Dogecoin retraced significantly from its yearly high of $0.485, encountering resistance at the $0.17 level. However, it managed to stabilize above the key Fibonacci level of 0.236 and the 200-week Simple Moving Average (SMA), both of which are set at $0.145.
Dogecoin Price Movement:Dogecoinは、年間最高値から0.485ドルから大幅に引き戻され、0.17ドルのレベルで抵抗に遭遇しました。ただし、0.236の主要なフィボナッチレベルと200週間の単純移動平均(SMA)を超えて安定化することができました。どちらも0.145ドルに設定されています。
This recovery also coincided with the cryptocurrency stabilizing above a rising trendline, which began in November 2023. Previously, the price tested this trendline twice, failing to break below it.
また、この回復は、2023年11月に始まった上昇傾向ラインを上回る暗号通貨の安定化と一致しました。以前は、価格はこのトレンドラインを2回テストし、それ以下で壊れませんでした。
According to crypto analyst Ali Martinez, as long as Dogecoin remains above the $0.13 support, it may be preparing for a substantial move upward. A candlestick close above the $0.17 resistance could propel the token to higher price levels, such as $0.21 or even $2.9.
CryptoアナリストのAli Martinezによると、Dogecoinが0.13ドルのサポートを超えている限り、大幅な上向きの動きに備えている可能性があります。 $ 0.17の抵抗を超えるろうそく足は、0.21ドルや2.9ドルなど、トークンをより高い価格レベルに推進する可能性があります。
Dogecoin's Historical Patterns:Analyst Trader Tardigrade took a broader view, examining Dogecoin’s price action using a 3-day chart that spans from 2014 to the present. The chart highlights key technical patterns.
Dogecoinの歴史的パターン:アナリストのトレーダーの遅刻は、2014年から現在までの3日間のチャートを使用してDogecoinの価格アクションを調べ、より広範な視点を見せました。チャートは、重要な技術パターンを強調しています。
The first triangle formed between 2014 and 2016, during which Dogecoin saw a downward price trend before breaking out to $0.04 and then consolidating underneath a descending trendline. This led to another breakout and subsequent surge in mid-2017. It sustained this run until January 2018, eventually hitting a new all-time high of $0.187.
最初の三角形は2014年から2016年の間に形成され、その間にDogecoinは0.04ドルに侵入してから下降するトレンドラインの下で統合する前に下向きの価格動向を見ました。これにより、2017年半ばに別のブレイクアウトとその後の急増が発生しました。 2018年1月までこのランを維持し、最終的には0.187ドルの新しい史上最高に達しました。
Similarly, the second symmetrical triangle, which developed between 2018 and 2021, followed a comparable pattern with a breakout that eventually resulted in a sharp price rally, peaking at the latest all-time high of $0.74.
同様に、2018年から2021年の間に発生した2番目の対称的な三角形は、最終的に鋭い価格の集会をもたらし、最新の史上最高の0.74ドルでピークに達した同等のパターンに続きました。
After Dogecoin collapsed from this peak as the 2021 bull run cooled, it formed a third symmetrical triangle. However, it finally broke out of this third triangle in late 2024 and sustained the breakout until recently, with the recent drop allowing it to retest the descending trendline.
2021年のブルランが冷却されたため、ドッグコインがこのピークから崩壊した後、3番目の対称三角形を形成しました。しかし、2024年後半にこの3番目の三角形から最終的に勃発し、最近までブレイクアウトを維持し、最近の低下により降順のトレンドラインを再テストすることができました。
According to Tardigrade, the latest breakout signals a potential for another upward move, with an anticipated price target of $2.9.
Tardigradeによると、最新のブレイクアウトは、予想される価格目標が2.9ドルで、別の上向きの動きの可能性を示しています。
With Dogecoin currently trading at $0.1593, a run to $2.9 would demand a 1,593% rally. Interestingly, last November, analyst Scofield already predicted a DOGE surge to $3.
DogeCoinが現在0.1593ドルで取引されているため、2.9ドルに走るには1,593%の集会が必要になります。興味深いことに、昨年11月、アナリストのScofieldはすでに3ドルの急増を予測していました。
 Analytics Insight: Latest AI, Crypto, Tech News & Analysis
 https://www.facebook.com/TechBullion/
 Insights
 https://web.facebook.com/Coinfomania/
 https://www.facebook.com/newsbtc


